Kumba Iron Ore Analysis 2026 — 12.8% Dividend, EV/EBITDA 2.0× and Net Cash: Gift or Trap?
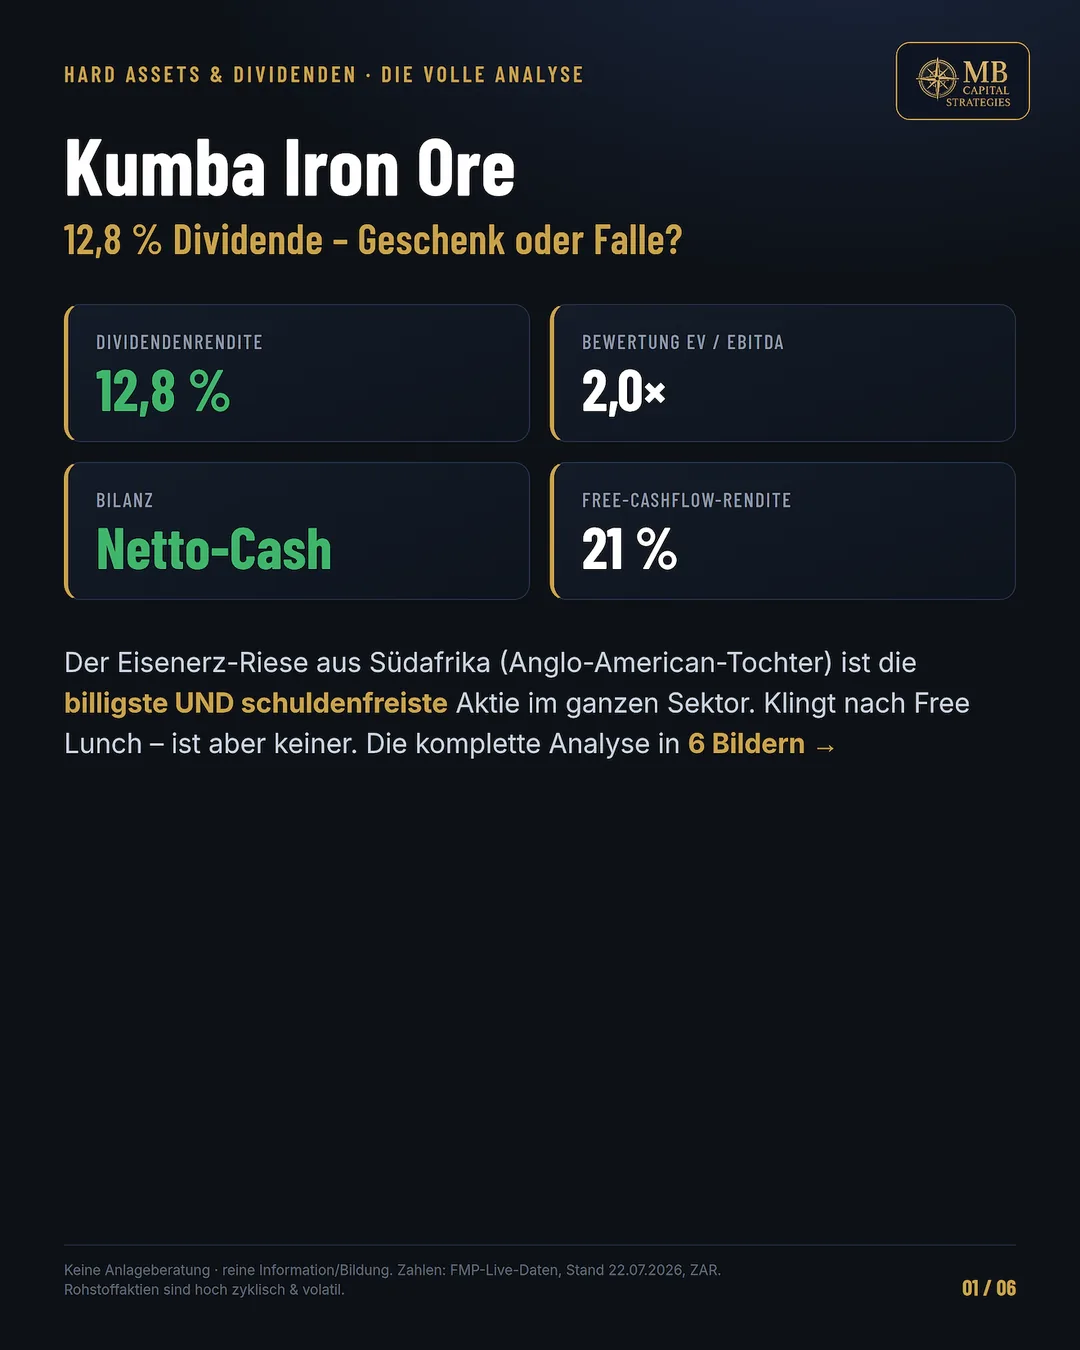
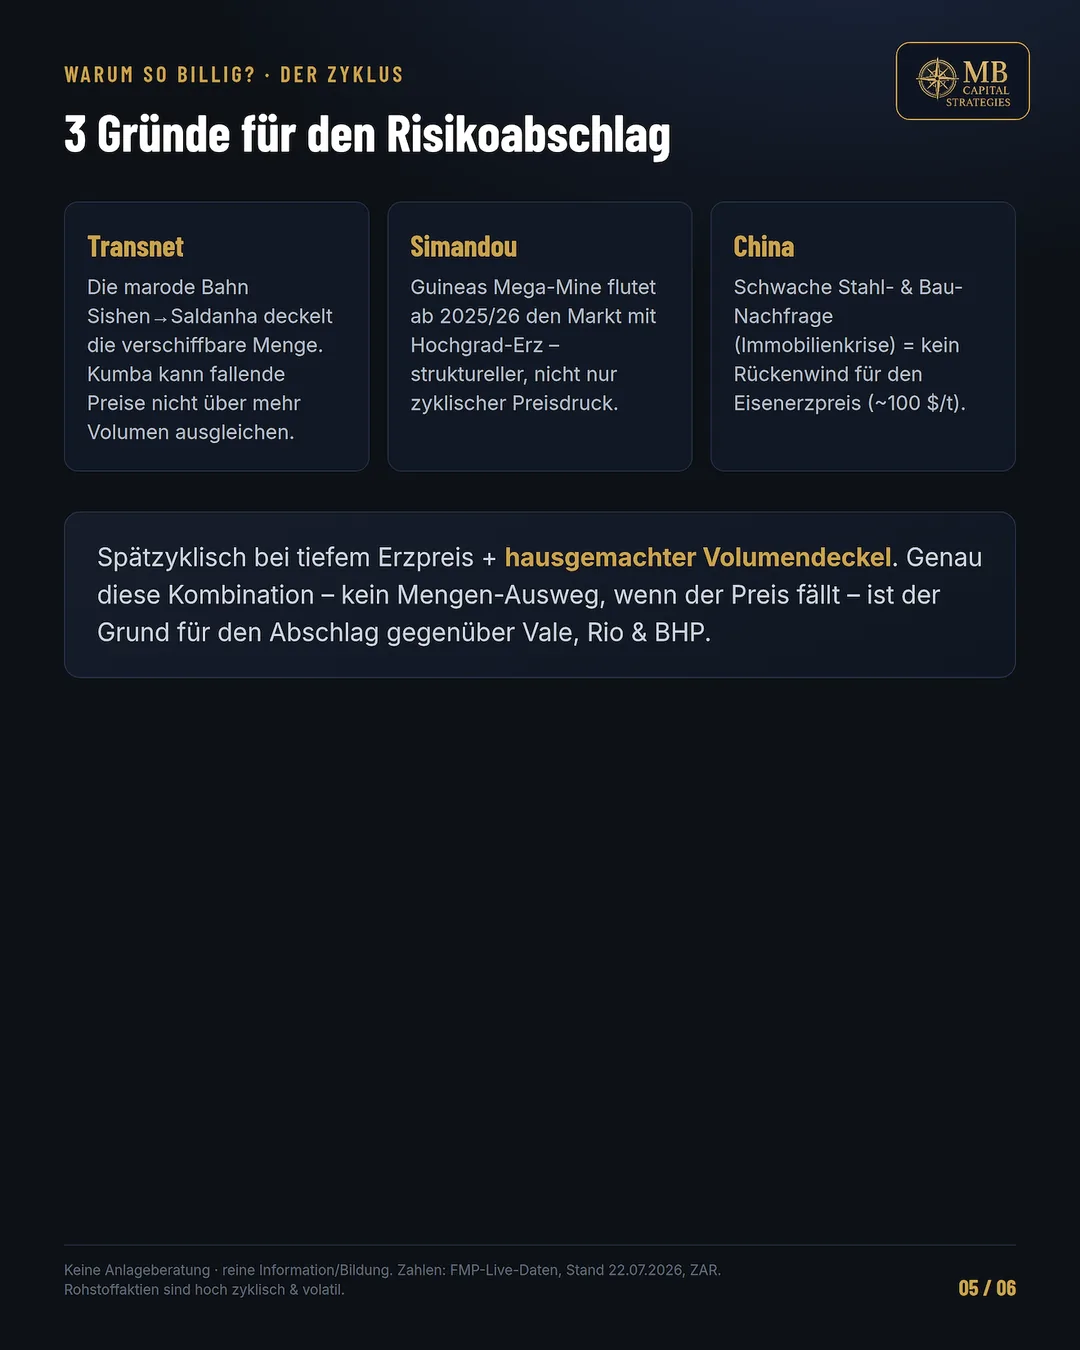
Kumba Iron Ore (JSE: KIO.JO) is the cheapest and most debt-free stock in the iron ore sector: 12.8% dividend yield, EV/EBITDA 2.0× (peers: 7–9×), net cash rather than net debt, FCF yield 21%. Sounds like a free lunch — but it is not. Three structural risks justify the discount: the broken Transnet rail, Simandou supply flood, China demand weakness. Verdict: no dividend cut, but a declining — not growing — dividend. You are buying a fortress balance sheet at a cyclical trough. Not financial advice.
I hold Kumba Iron Ore myself — 33 shares on Scalable Capital, publicly visible on Parqet. Skin-in-the-game matters here because this stock divides opinion sharply. On one side: a 12.8% dividend yield, EV/EBITDA of 2.0×, and a balance sheet that would make most investment-grade companies envious. On the other side: three concrete risks that fully explain why the market prices Kumba at a massive discount to BHP, Rio Tinto, and Vale. This analysis covers both.
Business Model — Sishen, Saldanha and the Anglo American Framework
Kumba is an Anglo American subsidiary (approximately 70% stake) operating the Sishen mine in South Africa's Northern Cape — one of the world's largest and highest-grade iron ore operations. The ore is transported by Transnet rail to Saldanha deep-water port on the west coast for export. The model is straightforward: mine, rail, ship. Capital-intensive and cycle-dependent.
Compared to peers: Kumba does only iron ore — no copper like BHP, no nickel like Vale, no diversification. That is both strength and weakness. Buying Kumba means taking a direct position on the iron ore price, Transnet capacity, and Chinese steel demand.
Peer Comparison — Why 4× Cheaper Than Vale, Rio & BHP?
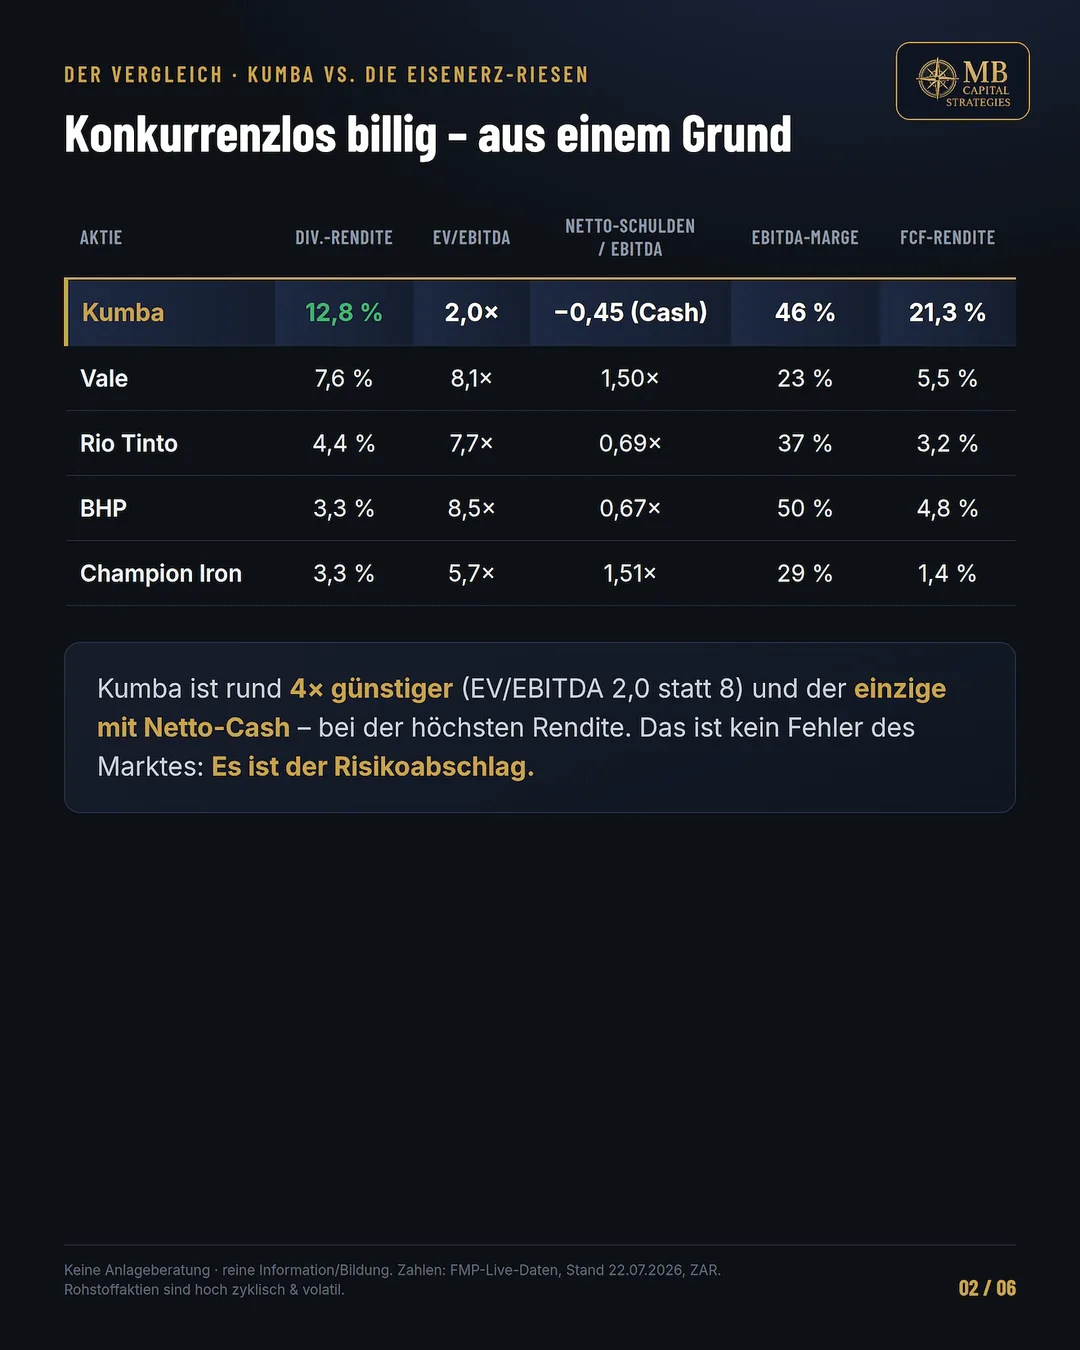
The numbers make for uncomfortable reading — which is precisely why they need explaining:
| Stock | Div. Yield | EV/EBITDA | Net Debt / EBITDA | EBITDA Margin | FCF Yield |
|---|---|---|---|---|---|
| Kumba Iron Ore | 12.8% | 2.0× | −0.45× (Net Cash) | 46% | 21.3% |
| Vale | 7.6% | 8.1× | 1.50× | 37% | 5.5% |
| Rio Tinto | 4.4% | 7.7× | 0.69× | 37% | 3.2% |
| BHP | 3.3% | 8.5× | 0.67× | 50% | 4.8% |
| Champion Iron | 3.3% | 5.7× | 1.51× | 29% | 1.4% |
Kumba leads on every single metric — except size and liquidity. EV/EBITDA 2.0× vs. 8× at BHP means you pay four times less for one dollar of EBITDA. This is not a market error. It is a risk discount — and it is justified.
Related: BHP Analysis 2026 — Dividend, Copper & Cashflow · Anglo American Analysis 2026
Dividend Coverage — How Safe Is the 12.8%?
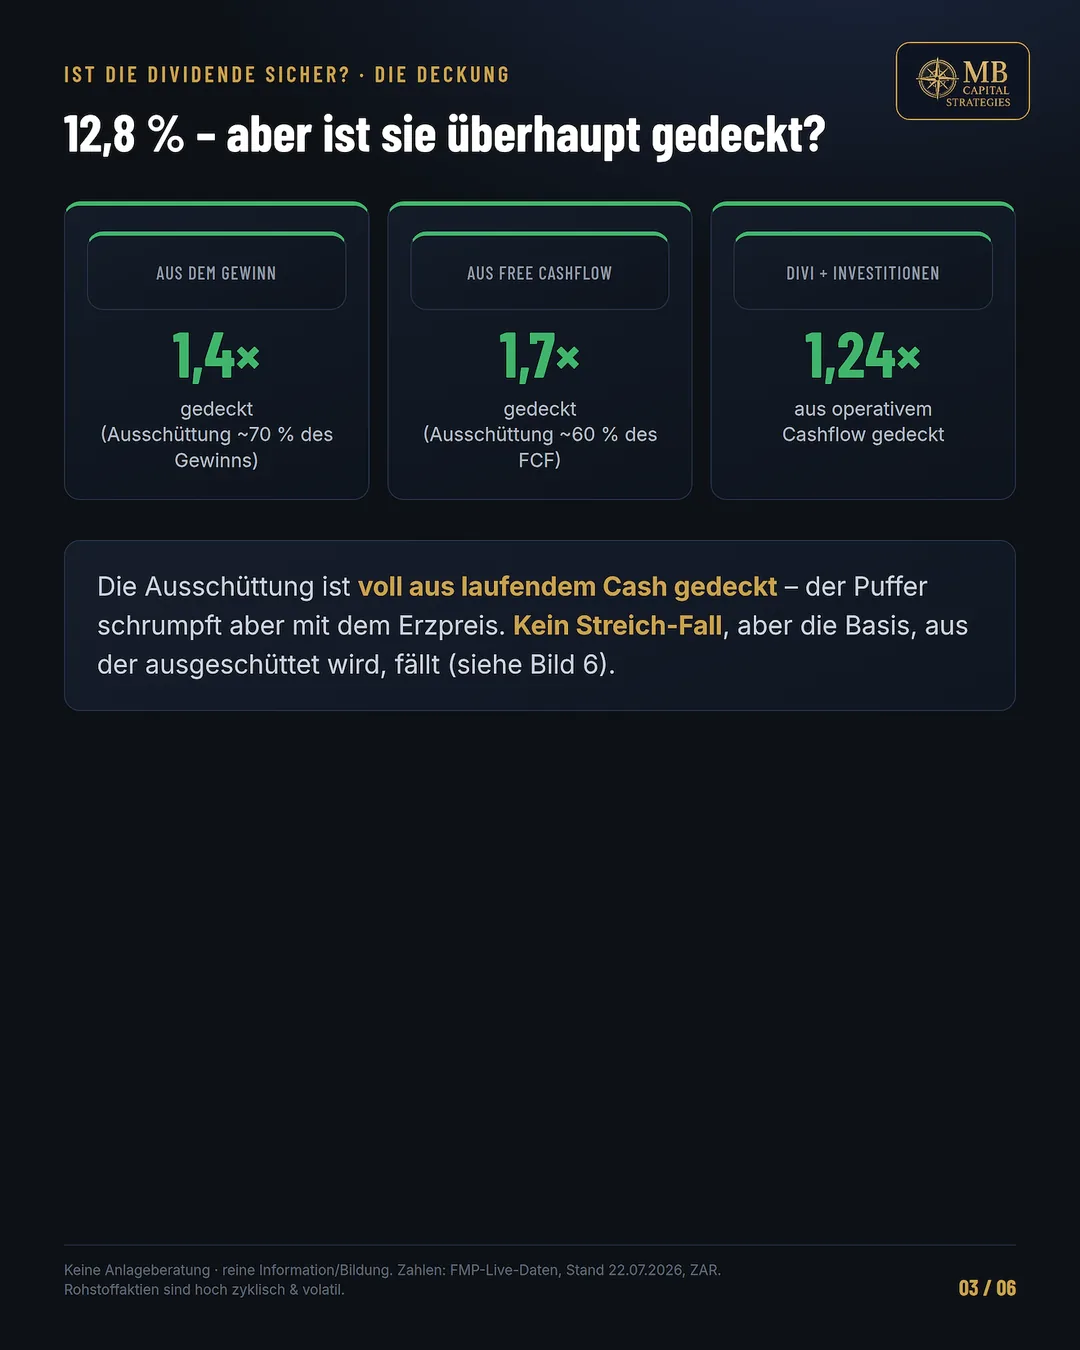
The good news first: the dividend is currently fully covered from operating cash.
- Earnings coverage: 1.4× — payout equals roughly 70% of earnings.
- Free cash flow coverage: 1.7× — payout equals roughly 60% of FCF.
- Dividends + capex: 1.24× covered from operating cash flow — Kumba can do both simultaneously.
Fortress Balance Sheet — The Real Differentiator
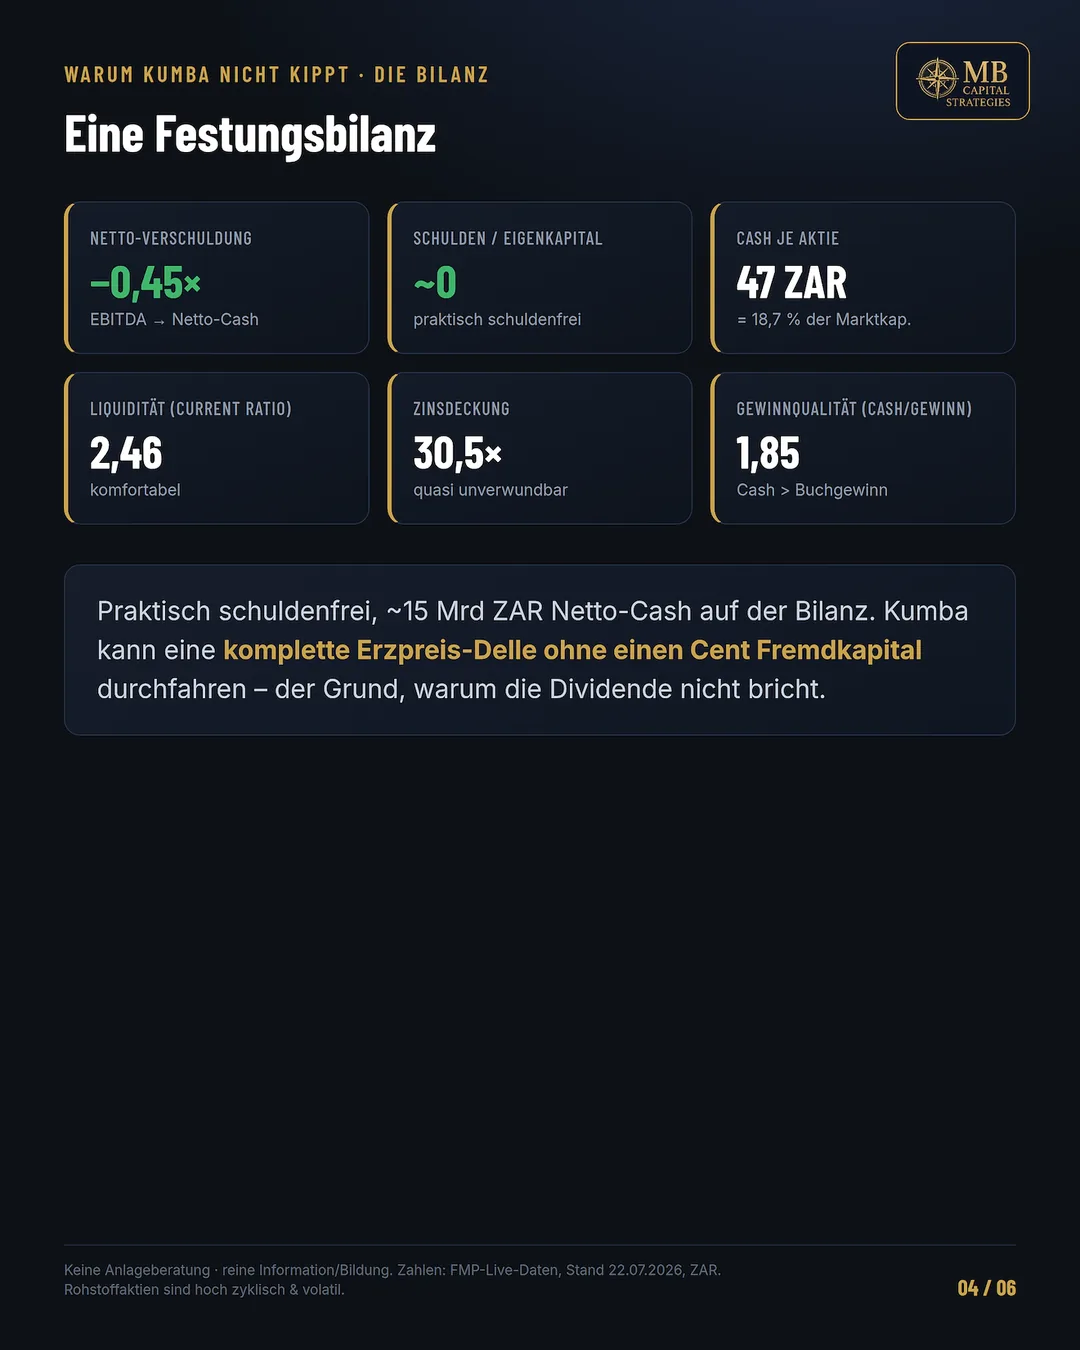
This is the core argument for Kumba — and the only reason the three risks below are tolerable:
- Net Debt/EBITDA: −0.45× — Kumba holds net cash. Not low debt. Net cash.
- Debt/Equity: near zero — the company is essentially debt-free.
- Cash per share: ZAR 47 — approximately 18.7% of market cap. You are buying cash at a discount.
- Current Ratio: 2.46 — short-term liabilities are covered more than twice over by liquid assets.
- Interest Coverage: 30.5× — Kumba generates nearly 31× more operating profit than it pays in interest.
- Earnings Quality (Cash/Earnings): 1.85 — Kumba earns more real cash than it books as accounting profit. The opposite of creative accounting.
Why So Cheap? — The 3 Risks That Justify the Discount
Check the Fundamentals Yourself
All metrics in this article were cross-checked via InvestingPro: FCF coverage, EV/EBITDA, dividend history, balance sheet ratios. For your own due diligence, I recommend the tool.
Get 15% off via my link — including current promotions →*Affiliate link. Commission at no extra cost to you. Not financial advice.
Bull / Base / Bear — Three Scenarios for the Dividend
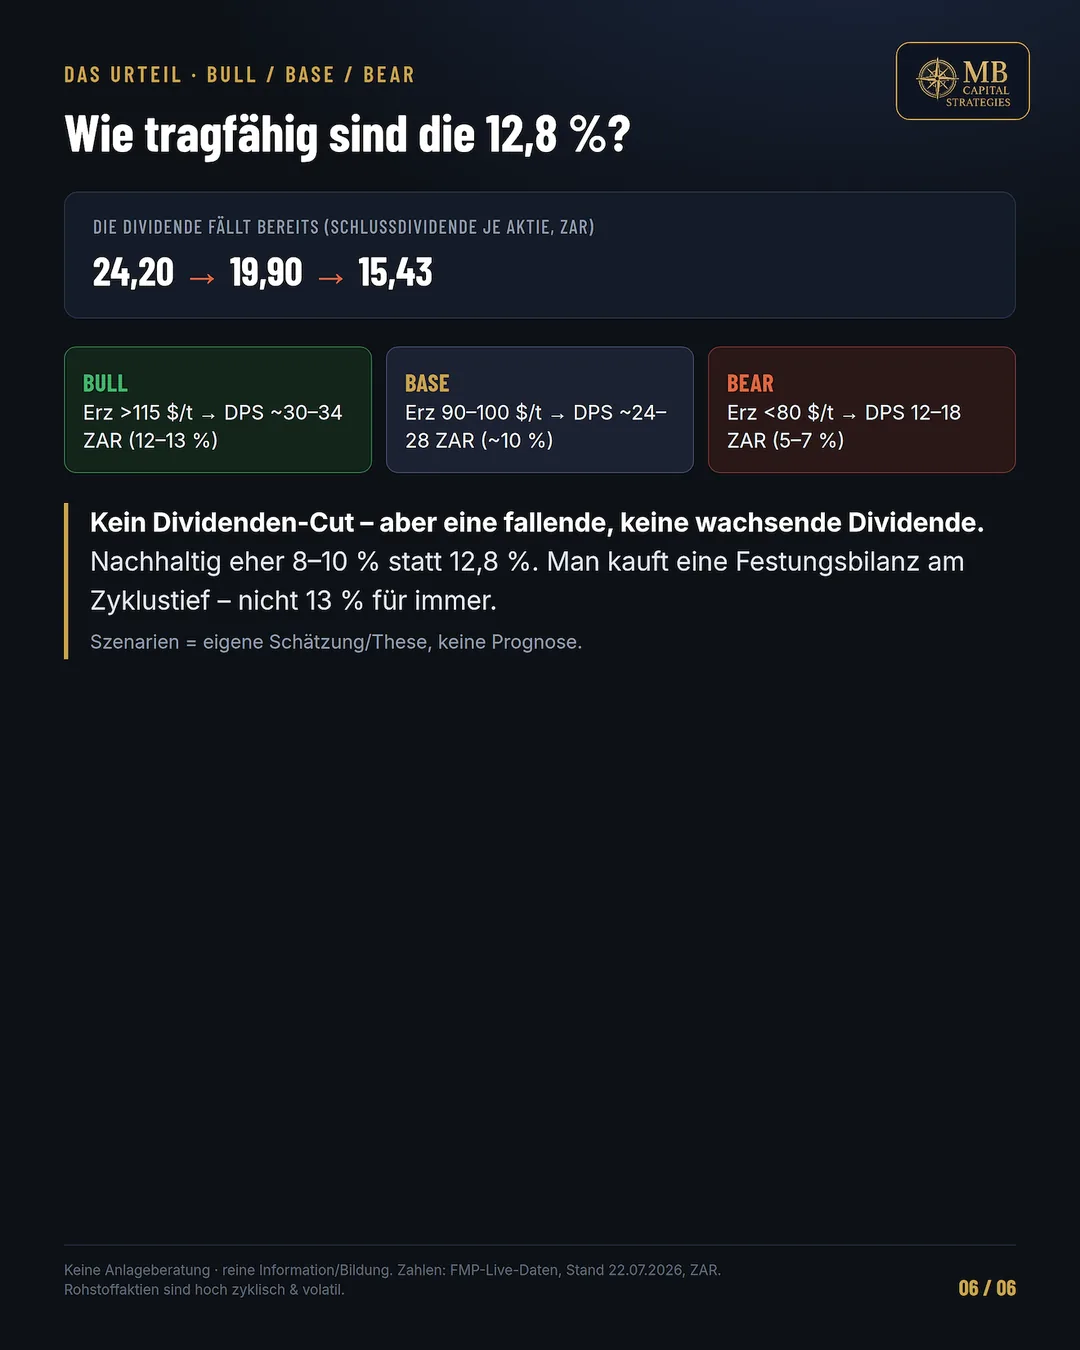
The dividend history already shows the direction: ZAR 24.20 → ZAR 19.90 → ZAR 15.43. The dividend is declining — that is fact, not trend projection. The scenarios below are my own estimates and theses, not forecasts:
BULL: Ore >$115/t
Final dividend approx. ZAR 30–34 per share
Yield: 12–13%
Requires: China recovery + Simandou delay + Transnet fix
BASE: Ore $90–100/t
Final dividend approx. ZAR 24–28 per share
Yield: ~10%
Most realistic scenario for 2026/27
BEAR: Ore <$80/t
Final dividend approx. ZAR 12–18 per share
Yield: 5–7%
No full cut, but significant reduction
Who Should Own Kumba Iron Ore?
Kumba is not a growth stock and not a trade. It is a cyclical trough investment in a fortress balance sheet carrying legitimate risks. These are the investor profiles for which Kumba could work:
- Hard asset investors — direct iron ore price exposure without conglomerate overhead.
- Dividend investors with high cycle tolerance — 8–10% sustainable yield is above-average even in the Base case.
- Cyclical trough hunters — EV/EBITDA 2.0× is historically cheap, but not risk-free.
Understanding mining costs: AISC Explained — All-In Sustaining Costs for Mining Investors →
How safe is the dividend? Dividend Coverage Ratio Explained →
Calculate Your Own Yield on Cost
What is your personal return on original investment? Use our free tool.
Try Yield on Cost Calculator →My Toolbox & Resources
Disclosure: Some links are affiliate links. This helps support our free content at no extra cost to you.