Chokepoint Economics: How Hormuz and Bab al-Mandeb Determine Oil Prices, Inflation and Dividend Portfolios
Hormuz –66% traffic · Brent $91 · Drewry WCI $4,639 · War Risk 3–10% · Fertilizer +30% · FAO 130.3 — the complete chain explained, four historical precedents, three scenarios and an honest valuation chapter.

Independent Investor & Analyst · Hard Assets & Dividends
The Direct Answer: What Is Happening and Why It Matters
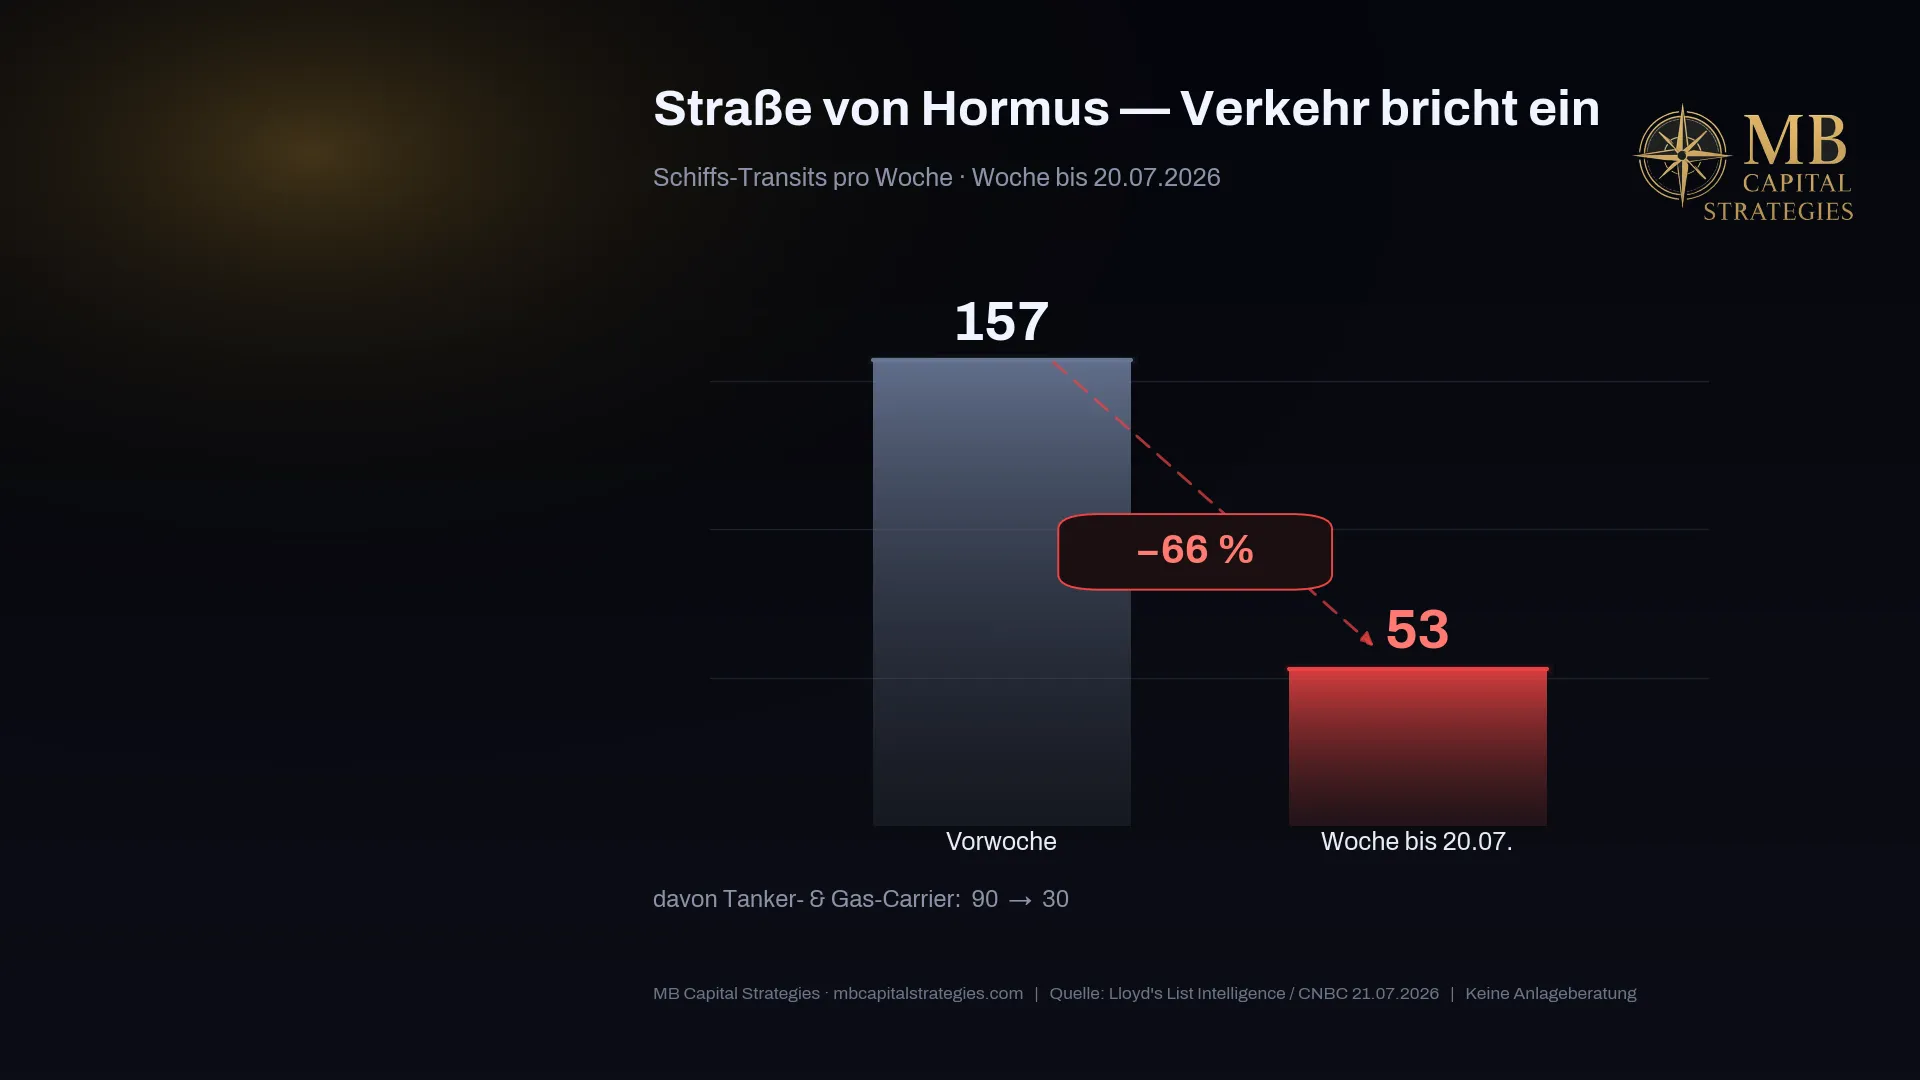
Shipping traffic through the Strait of Hormuz collapsed by 66% in the week ending July 20, 2026 — from 157 to just 53 transits per week (source: Lloyd's List Intelligence). At the same time, the Houthis declared an immediate maritime embargo against Saudi Arabia on July 20, 2026, blocking Bab al-Mandeb for Saudi vessels. That is the double blow.
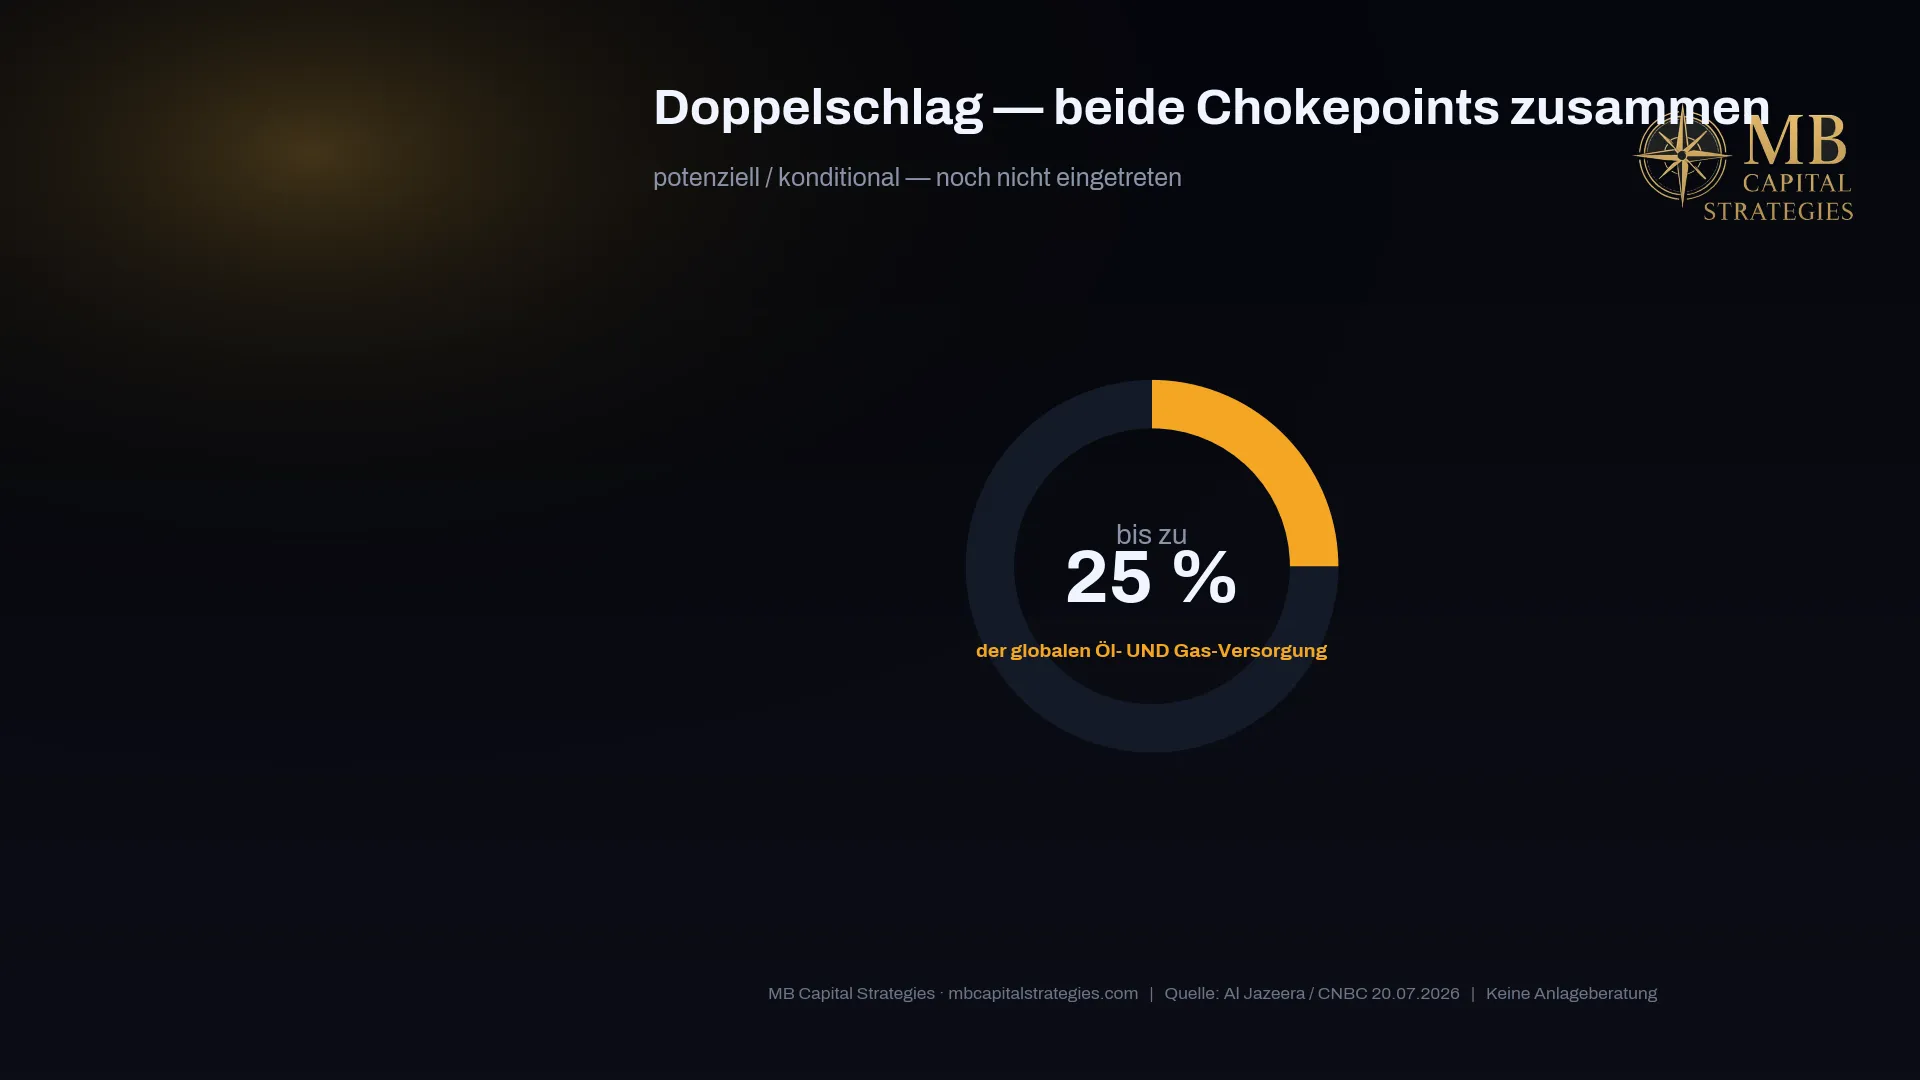
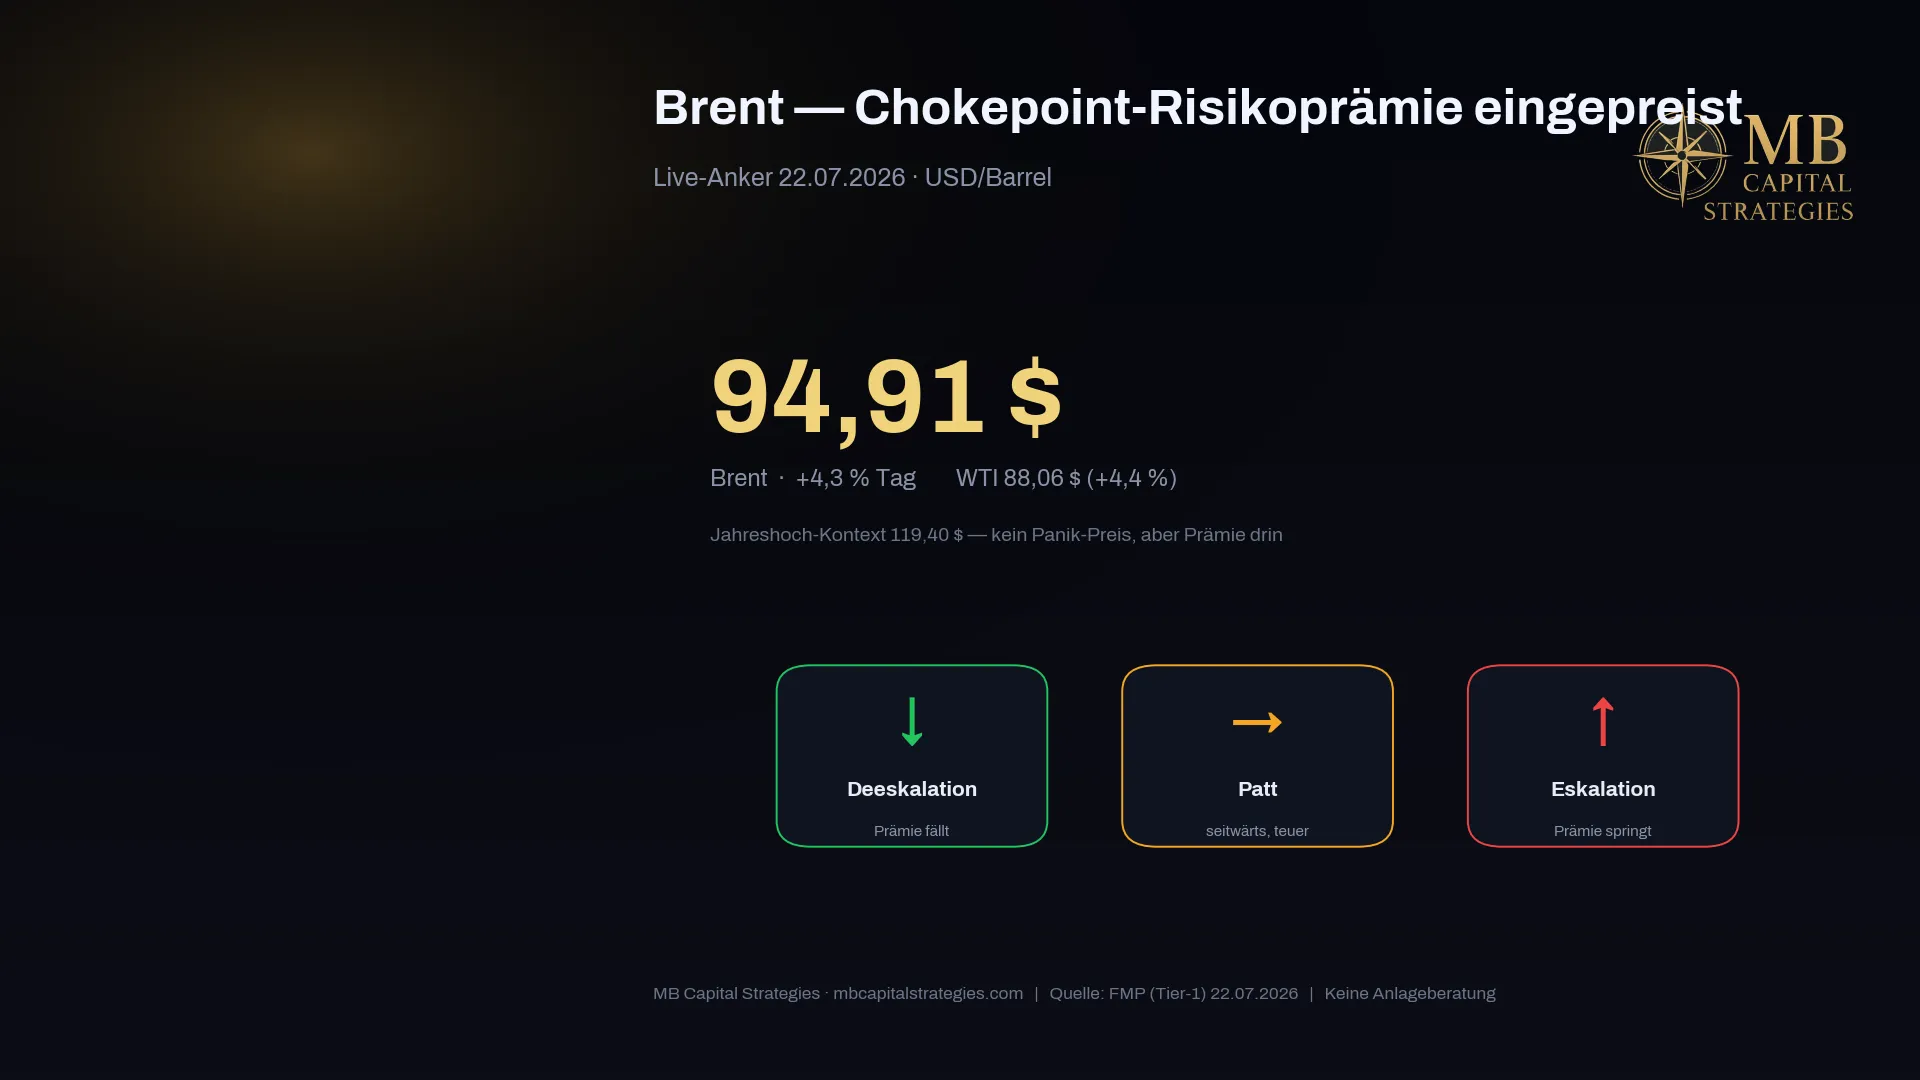
Together, both straits could affect up to 25% of global oil and gas supply by sea (source: Al Jazeera, CNBC, July 20, 2026). Brent (BZUSD) was trading at $91.39 on July 21, 2026 — well above its 200-day MA of $82.95 and its 50-day MA of $84.59. The Drewry World Container Index stood at $4,639 per 40-ft container on July 9, 2026, the highest level since September 2024.
What this means for inflation, fertilizer, food security and a hard-assets dividend portfolio — that is what this article and the accompanying 87-minute video cover.
1. The Two Chokepoints: What Is Really Happening
Strait of Hormuz: 33 Kilometres, 20% of the World's Oil
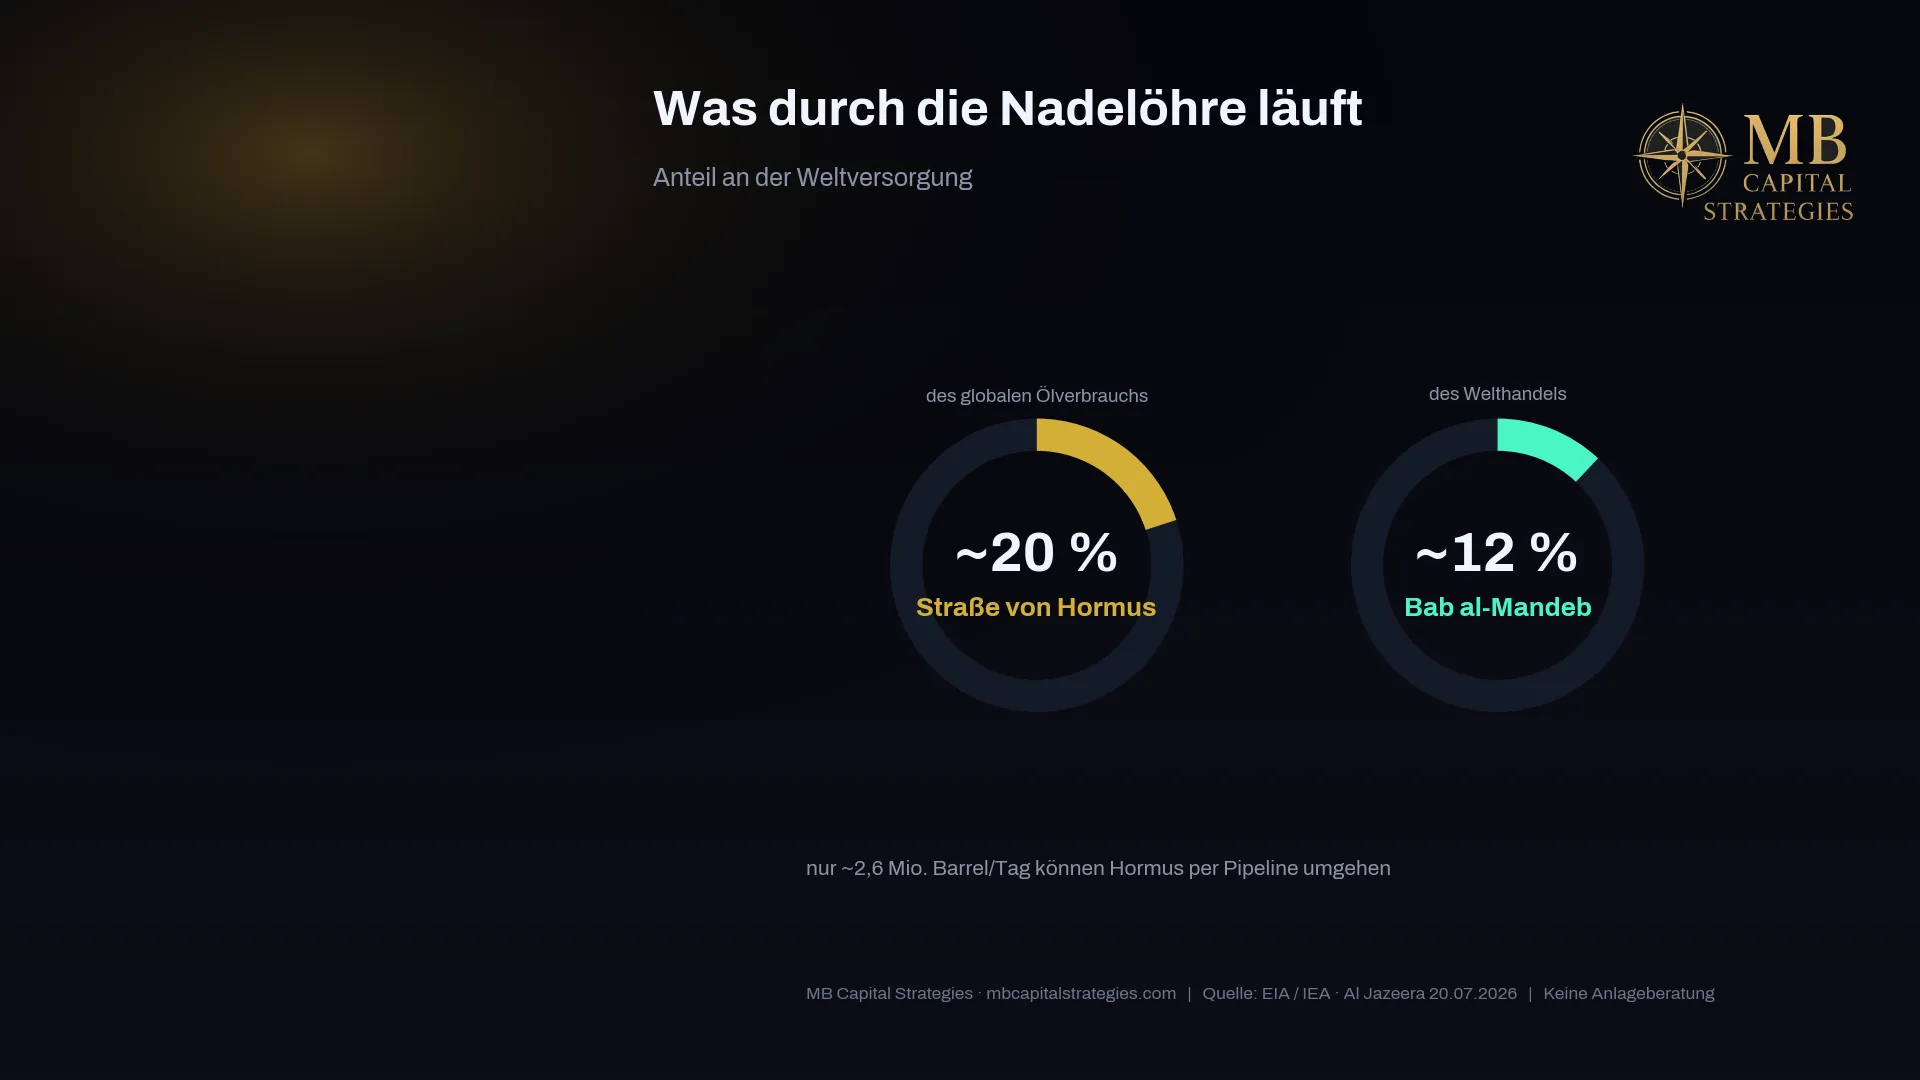
Roughly 20% of global oil consumption — around 20 million barrels per day on average — flows through the Strait of Hormuz (sources: EIA, IEA). Only about 2.6 million barrels per day can be rerouted via pipeline. Everything else has no alternative. Since early July 2026, at least nine vessels have been attacked according to CNBC, as Iran forces tankers into its territorial waters. Traffic is severely reduced, but not zero — an important distinction from a full-embargo scenario.
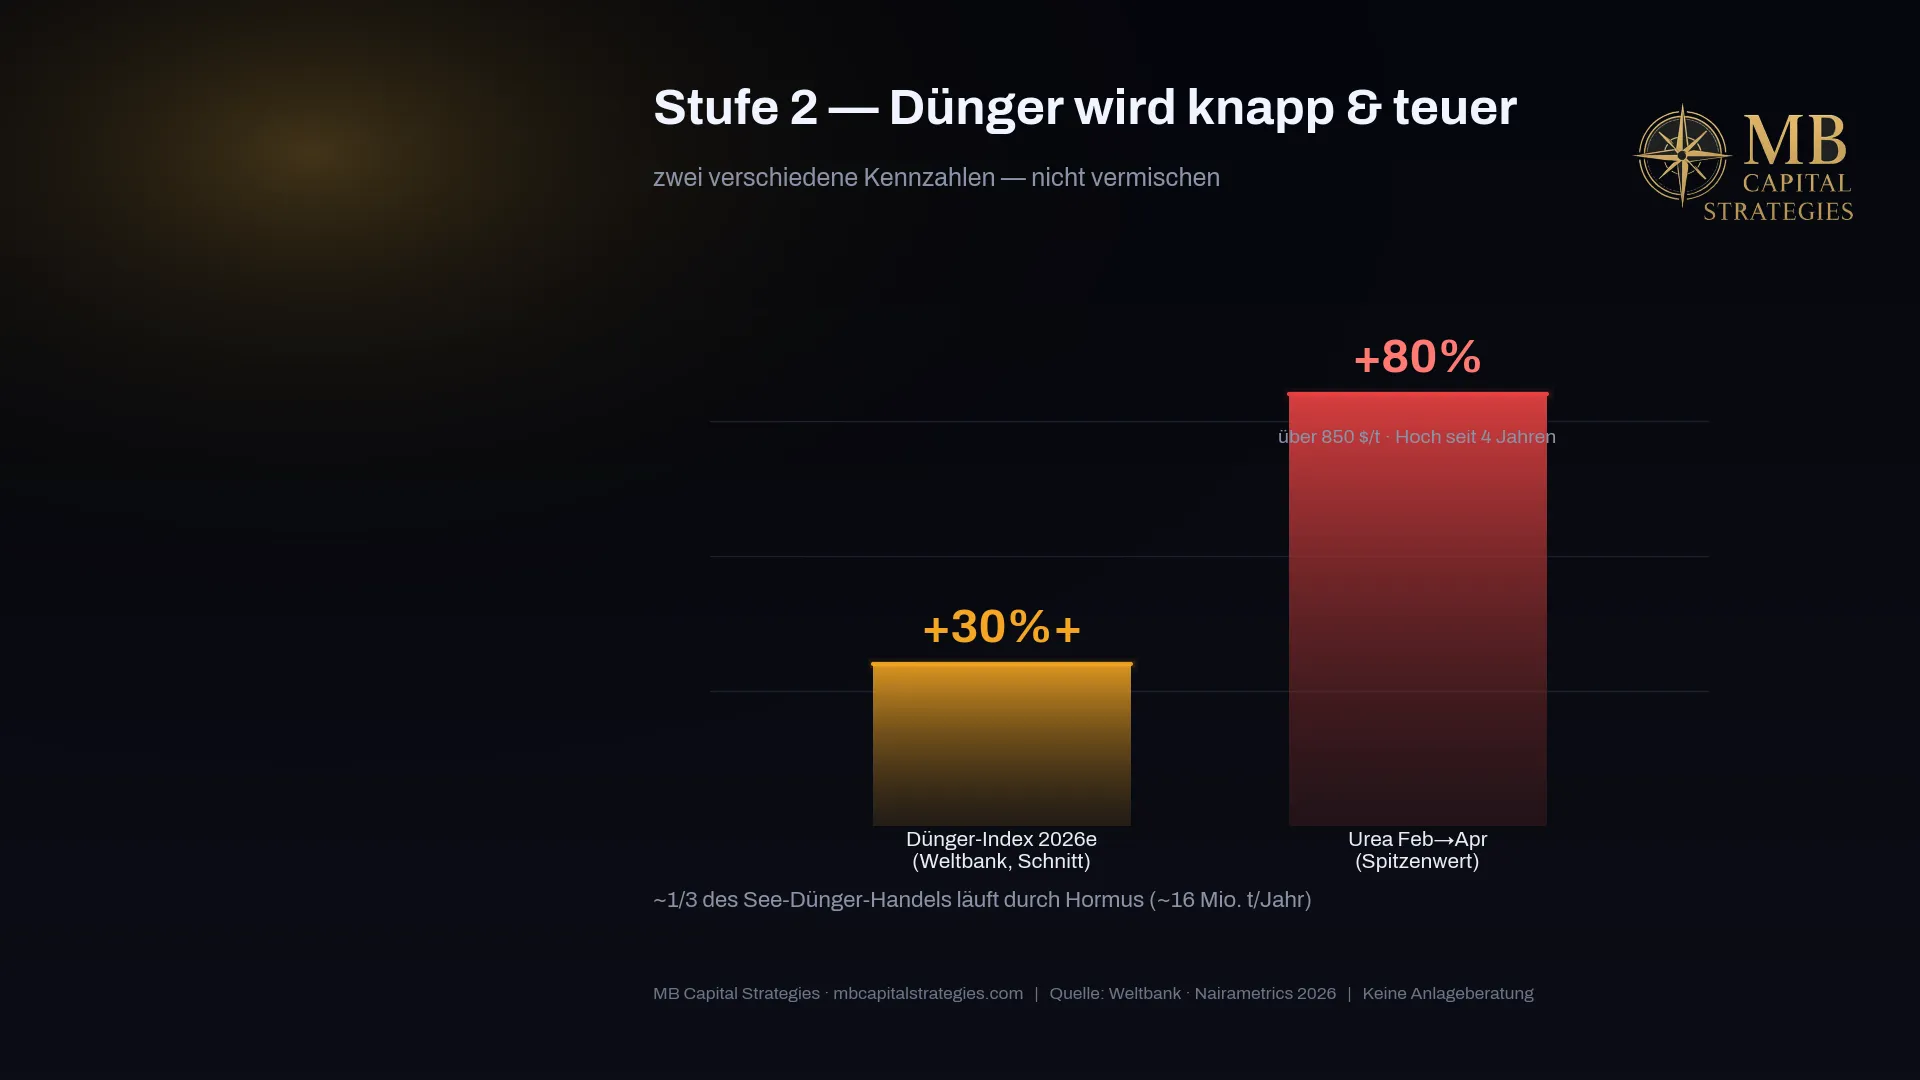
About one-third of global seaborne fertilizer trade also passes through Hormuz — roughly 16 million tonnes per year (sources: World Bank Blog, UN News). That feeds directly into fertilizer prices and, with a delay, into the food chain.
Bab al-Mandeb: Houthi Embargo Against Saudi Arabia
On July 20, 2026, the Houthis announced an immediate maritime embargo against Saudi Arabia — a retaliatory measure for the attack on Sanaa Airport ("an eye for an eye", spokesman Yahya Saree). Normally, around 12% of global trade passes through Bab al-Mandeb (sources: Al Jazeera, CNBC, PBS News, July 20, 2026).
The double blow is the number that matters: together, both straits could affect up to 25% of global oil and gas supply by sea.
2. The Cascade: From Strait to Supermarket Shelf
Cape of Good Hope Rerouting
Cape rerouting adds 10 to 15 transit days and roughly 3,800 nautical miles to an Asia-Europe voyage. This has displaced an estimated 10% of the global container fleet onto the longer route (sources: Maritime Gateway, The National, July 17, 2026). The result: less effective capacity at unchanged demand — a structurally tighter freight market.
Drewry World Container Index and War Risk Premium
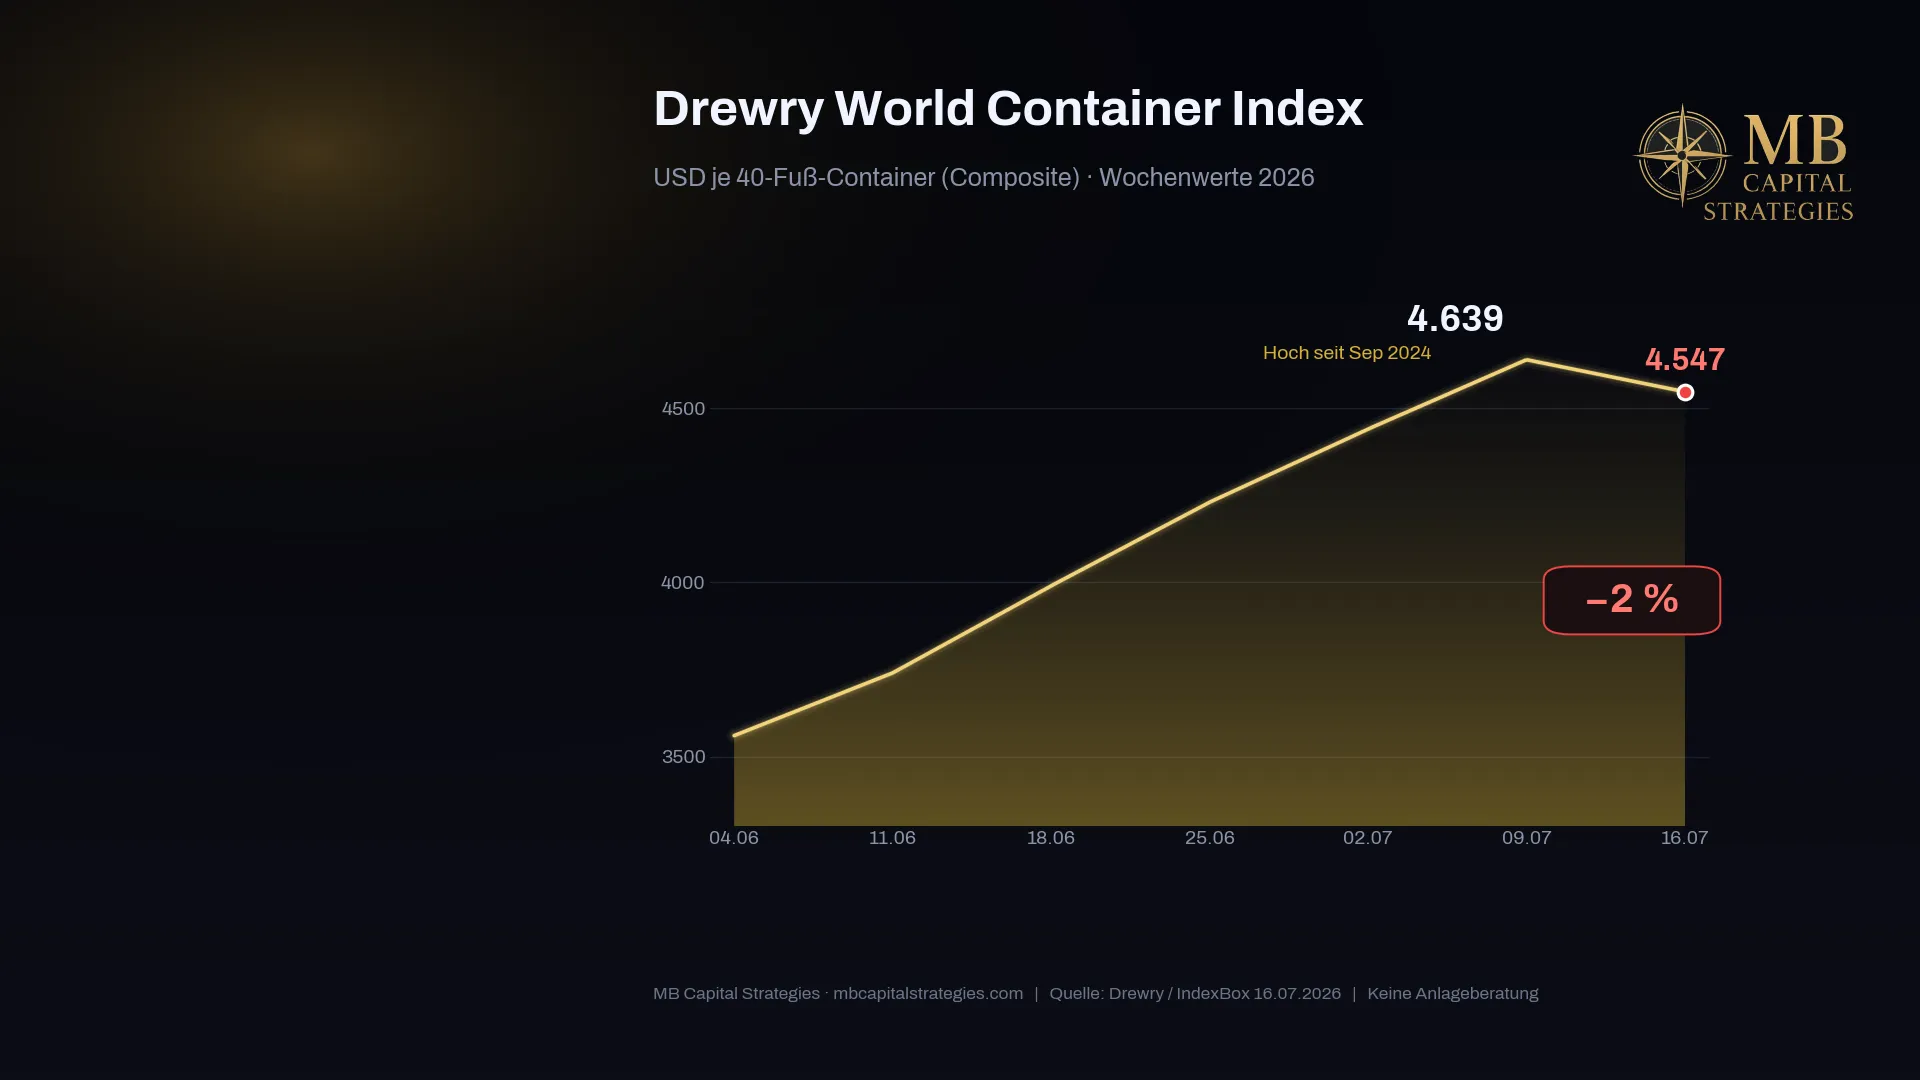
The Drewry WCI reached its highest level since September 2024 on July 9, 2026 — $4,639 per 40-ft container — before easing 2% to $4,547 by July 16, 2026 (sources: Drewry, IndexBox/Sogese).
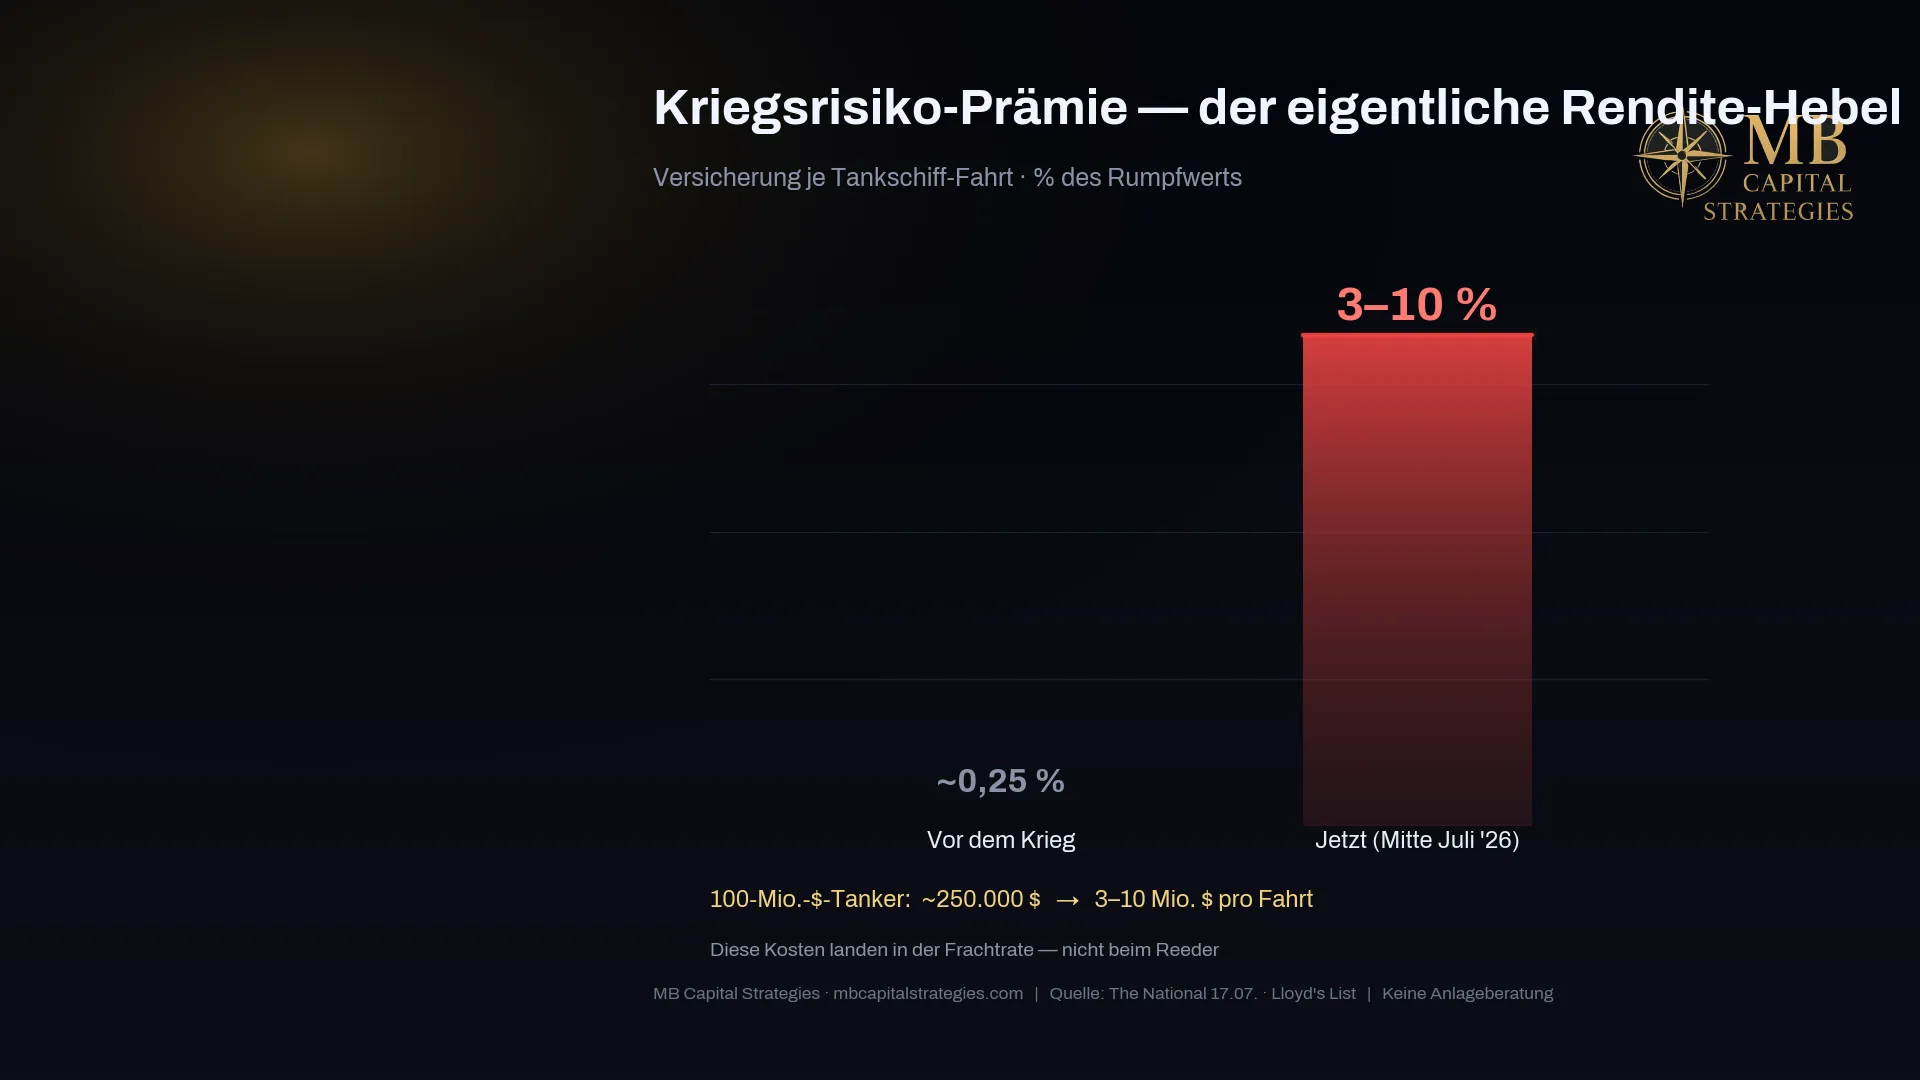
The real earnings mechanism for shipping stocks, however, lies in war risk insurance: the premium surged to 3–10% of hull value by mid-July 2026, compared to roughly 0.25% pre-war. A $100 million tanker now pays $3–10 million per voyage in war risk premiums vs. roughly $250,000 before the conflict (sources: The National, July 17, 2026; Lloyd's List).
The Fertilizer Cascade: World Bank +30%, Urea +80%
Because one-third of global seaborne fertilizer trade passes through Hormuz, supply disruptions feed through to agriculture — not immediately, but via the next planting season. The World Bank projects the fertilizer price index will rise more than 30% in 2026 (source: World Bank Blog). Urea/nitrogen alone surged above $850/tonne in April 2026 — up 80% since February and the highest level in four years (sources: World Bank Blog, Nairametrics).
FAO Food Price Index: A Nuanced Picture
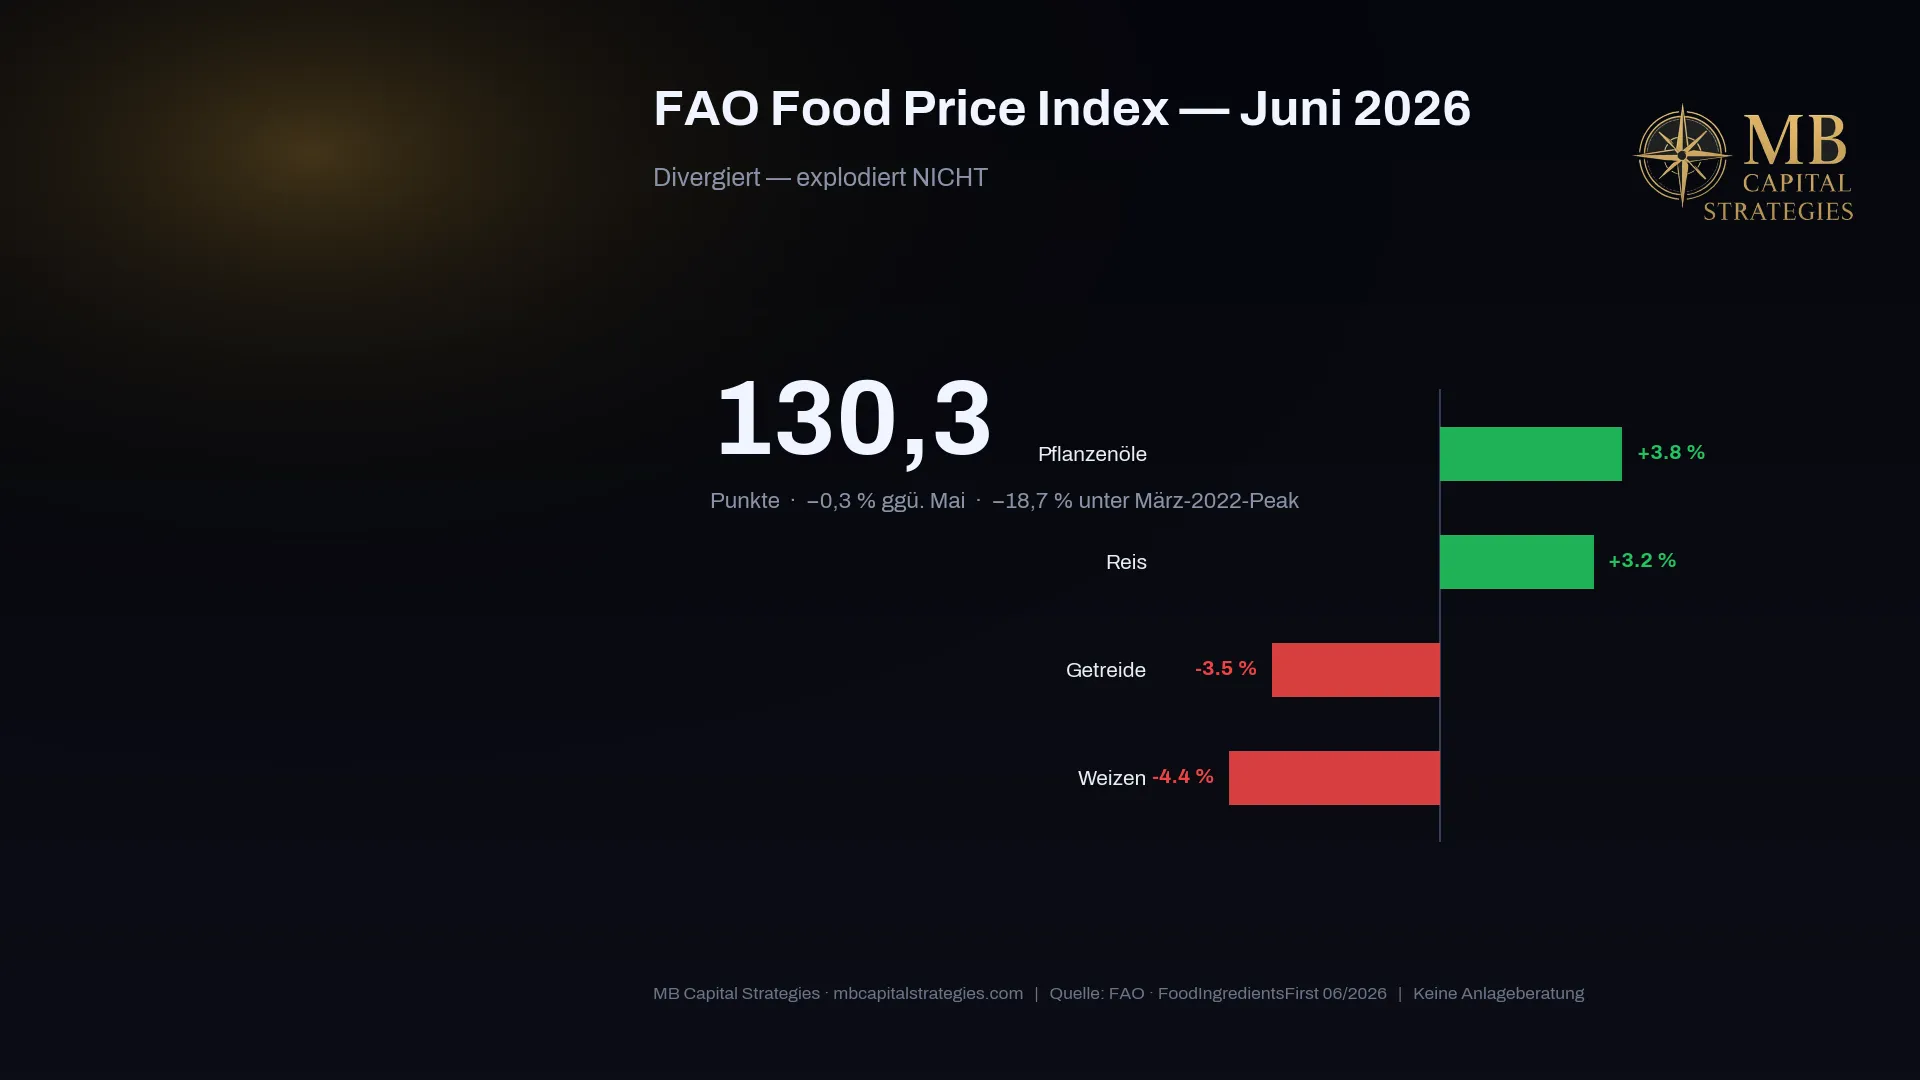
The FAO Food Price Index stood at 130.3 points in June 2026 — 0.3% below May and 18.7% below the March 2022 peak. That matters: not all food prices are exploding. Cereals actually fell 3.5% (wheat –4.4%, helped by a Black Sea harvest). Vegetable oils rose 3.8% and rice 3.2% (source: FAO). The chokepoint effect works with a lag: through more expensive fertilizer, then through the next planting cycle, and only then into harvest prices — that is Q3/Q4 2026, not an immediate shock at the supermarket checkout.
[THESIS] The FAO chief economist stated conditionally in April 2026 that "the clock is ticking" on fertilizer deliveries. If farmers cannot afford or access nitrogen inputs, this could reduce yields and push grain prices higher in Q3/Q4 2026. That is a thesis with a measurable risk attached — not a certainty.
Food Security: Up to 45 Million Additional People (Conditional)
The World Food Programme estimates that up to 45 million additional people could fall into acute food insecurity — if the conflict continues beyond Q2 and if oil stays above $100, measured from a pre-war baseline of 318 million (sources: UN News, WFP). That conditionality matters: this is a risk scenario, not an automatic outcome.
3. The Central Bank Dilemma: ECB Reacts, Fed Looks Through
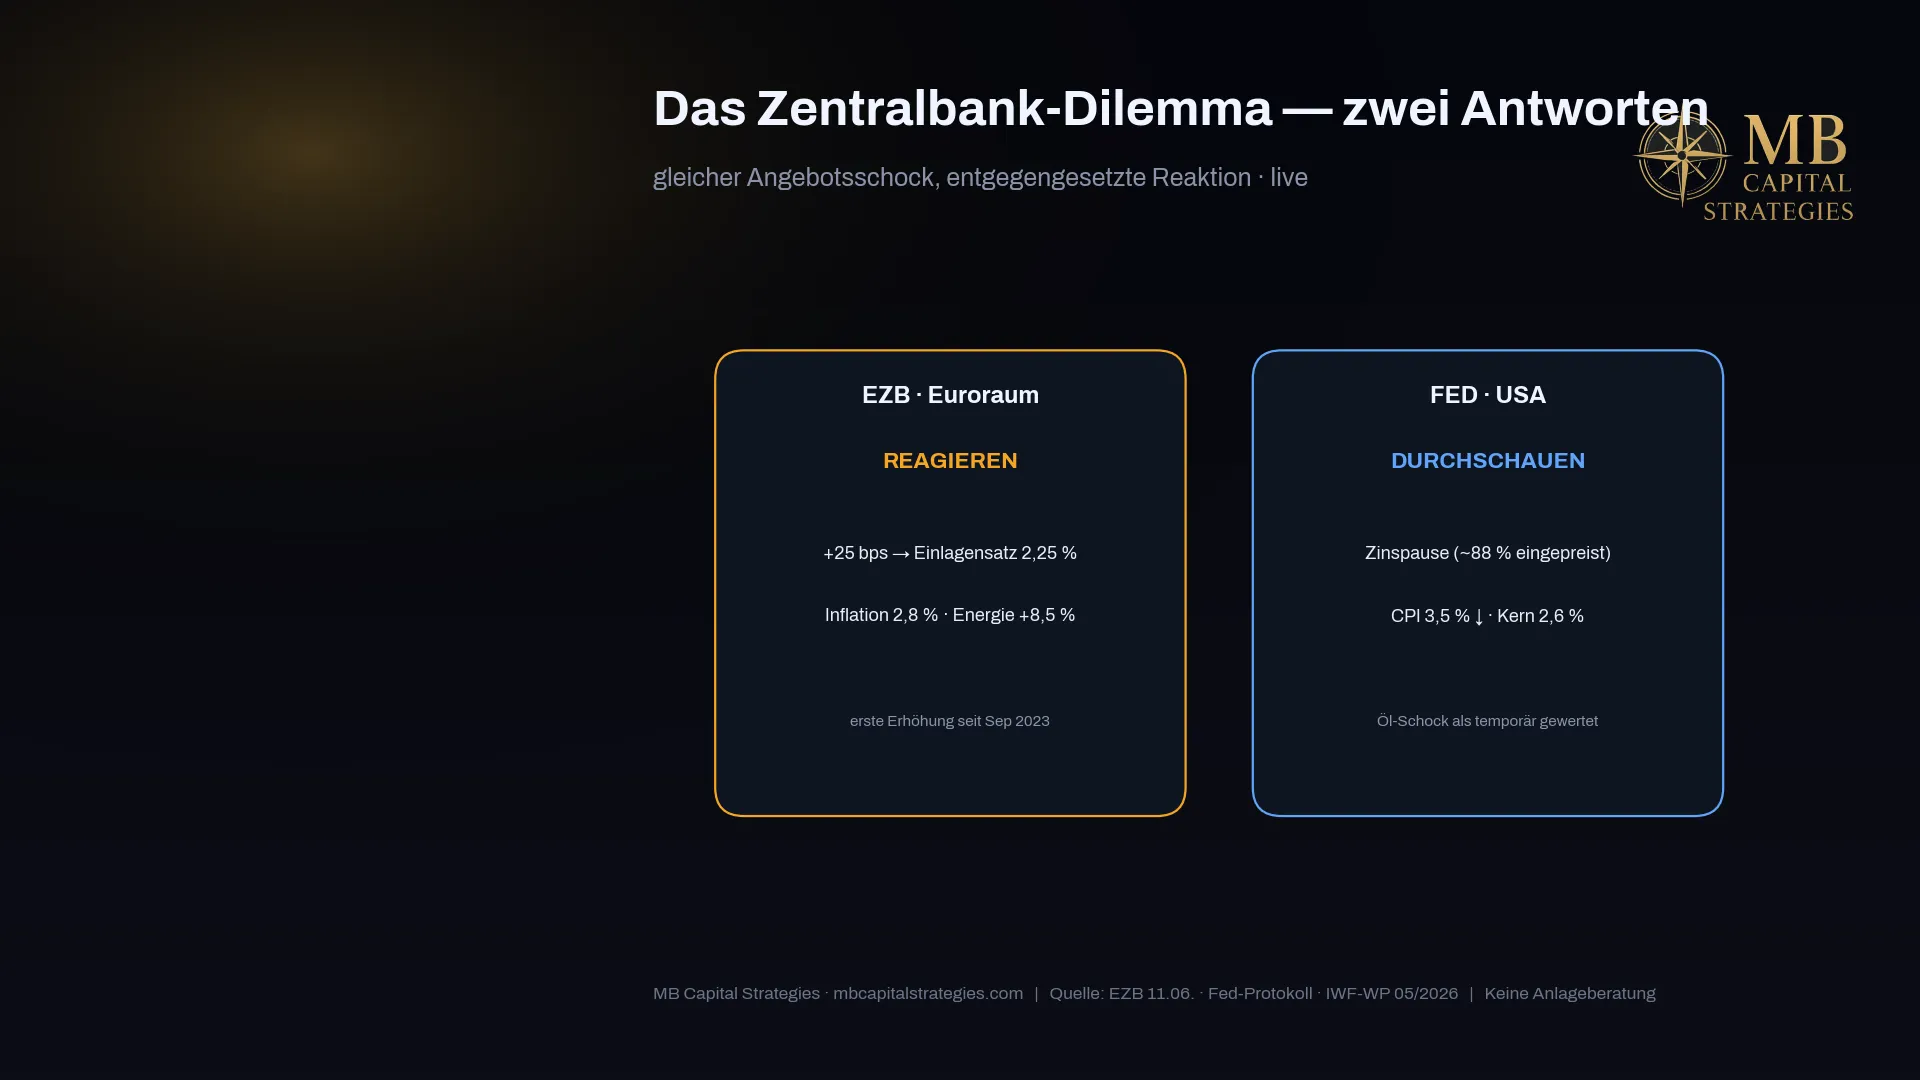
A chokepoint shock is a supply shock — it pushes prices up without stimulating demand. That is the hardest scenario for central banks: higher rates fight inflation but simultaneously choke economic growth. That is why the ECB's response differs from the Fed's.
The ECB reacts more forcefully because Europe is directly dependent on Middle East imports and eurozone economies are more sensitive to energy price swings. The Fed, by contrast, tends to look through the supply shock — US shale oil provides a buffer, and the Fed has incorporated the 2022 inflation lessons: you do not fight supply shocks with rates alone.
4. Four Historical Precedents
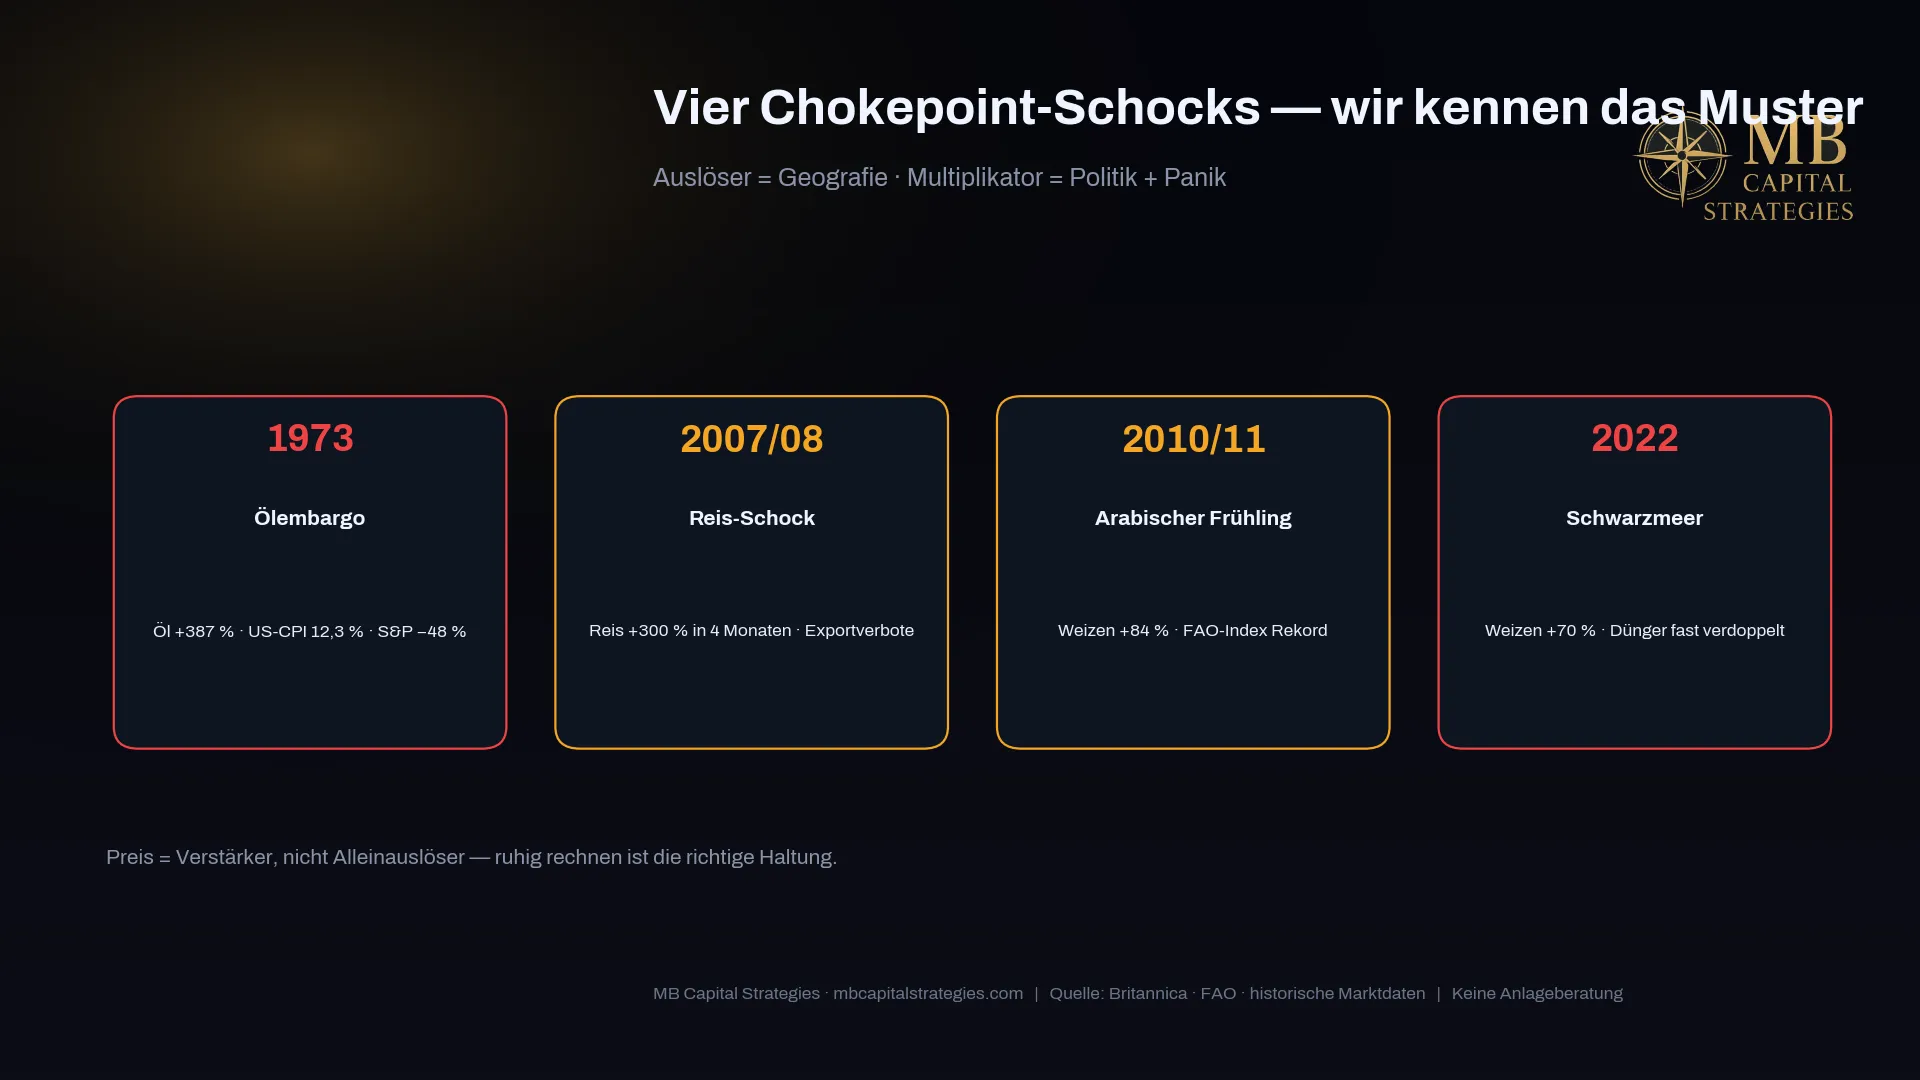
Geopolitical shocks in the Middle East and food markets are not new. History teaches: price is the amplifier, not the cause. Four cases with clear parallels to the current double blow:
1973 — OAPEC Oil Embargo
Arab nations halted oil deliveries to the US and Western Europe in response to the Yom Kippur War. Brent equivalent rose from roughly $3 to over $12/barrel. German inflation exceeded 7%. Parallel today: a Middle East supply shock, politically motivated, with direct inflationary consequences.
2008 — Rice Crisis
Rice prices tripled within months, triggered by export restrictions and speculative waves. The FAO food price index surged to 200 points. Parallel today: bottleneck effects in a single commodity chain spread systemically.
2011 — Arab Spring
Political instability across the Middle East drove Brent to $127/barrel. Egypt and Tunisia, already under pressure from high food prices, became the trigger for political unrest. Parallel today: geopolitical escalation plus food price pressure equals social instability in import-dependent countries.
2022 — Black Sea Crisis
Russia's invasion of Ukraine blocked wheat exports from Europe's "breadbasket." FAO index hit 159.7 in March 2022. Parallel today: a critical commodity route disrupted — this time not grain but oil, gas and fertilizer through Hormuz and Bab al-Mandeb.
5. Three Scenarios and the 2-Number Dashboard
Oil or shipping rate forecasts are guesswork. What investors need are scenarios — and two numbers that let them track the crisis themselves, without depending on any guru.
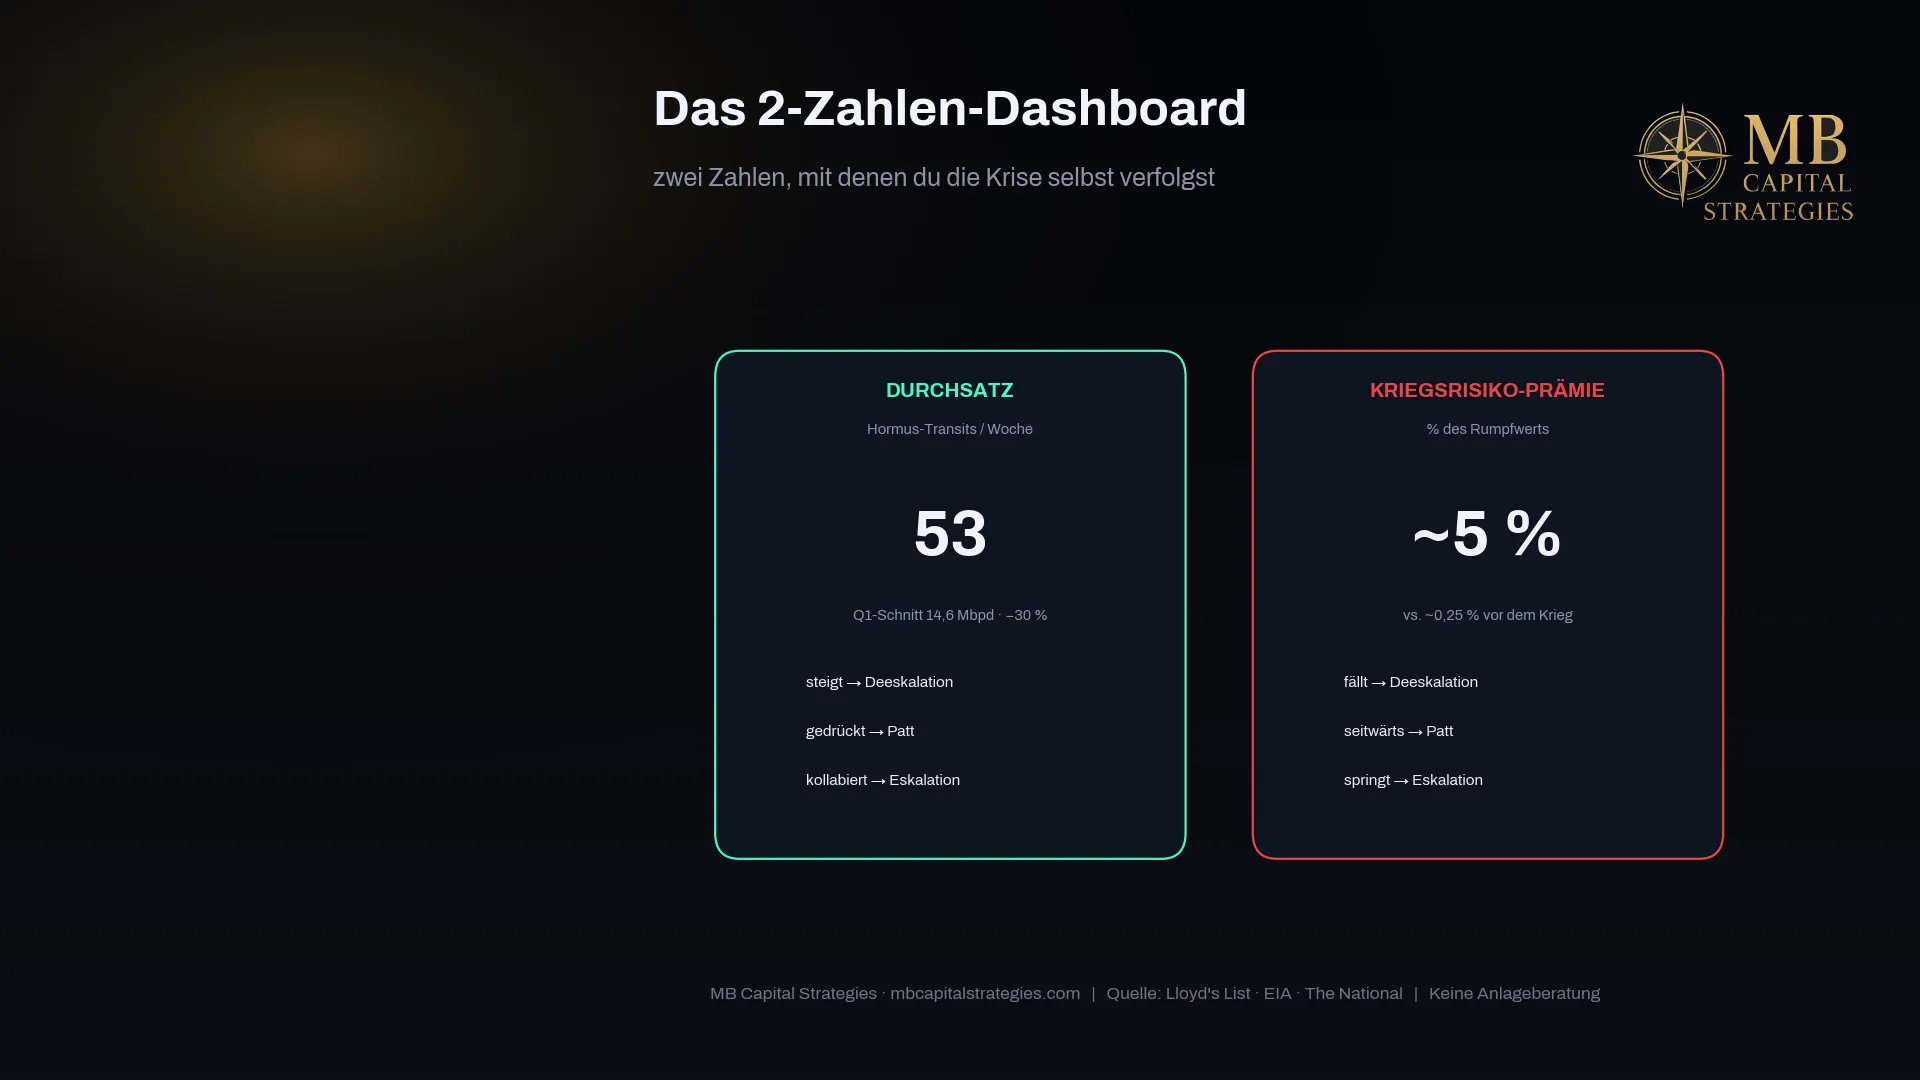
The 2-Number Dashboard
- Hormuz Transits: 53/week at the time of writing (–66%) — a fast-moving figure, check the current reading before acting. Transits rising = relief priced in. Transits falling further = escalation signal.
- War Risk Premium: ~5% of hull value at the time of writing. Premium falling below 1% = market pricing de-escalation. Premium rising above 10% = market pricing escalation.
Scenario 1: De-escalation (~6 weeks)
Hormuz transits recover above 120/week. War risk falls below 1%. Brent returns to the $70–80 range. Tanker rates normalize. FAO fertilizer effect stays limited as a deal comes before the planting season. For shipping stocks: war risk premium drops first, potential share price pullback.
Scenario 2: Stalemate (3–6 months)
Hormuz remains reduced (50–80 transits/week), war risk stabilizes at 3–5%. Brent oscillates between $85 and $100. Fertilizer cascade plays through fully. FAO index rises in Q3/Q4. ECB keeps rates elevated. Tanker rates remain structurally firm — the most interesting investment scenario for shipping holders.
Scenario 3: Full Escalation
Full Hormuz closure. Brent above $120. War risk at 10%+. No ship earning peak rates is still sailing. Stagflation risk. WFP conditional scenario becomes reality. For portfolios: extreme short-term volatility; tanker freight rates collapse as a function of voyages becoming uneconomic.
6. The Valuation Chapter: Who Benefits — and at What Price?
Three upfront notes I take seriously:
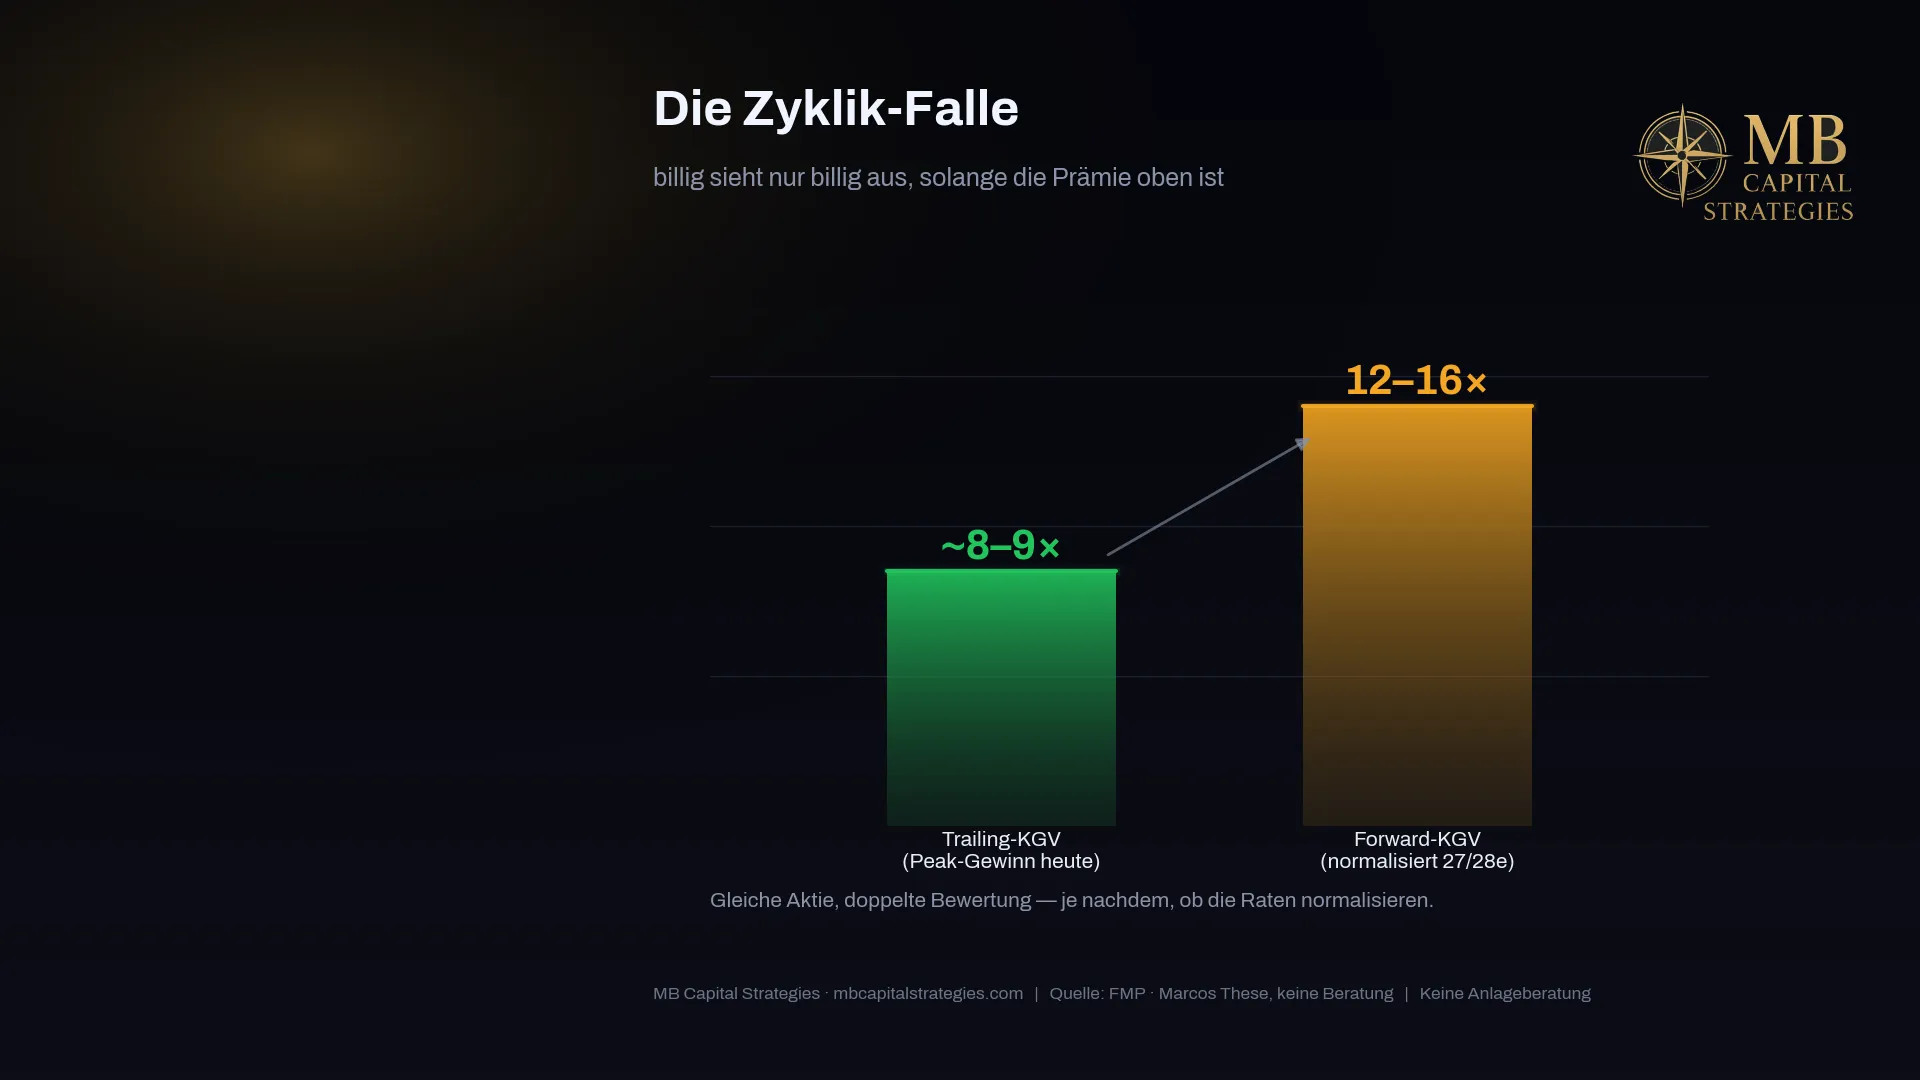
- The cyclicality trap: Trailing P/E ratios for crude tankers sit at 8–10×, which looks cheap. On normalized forward earnings estimates for 2027/28, that rises to 12–16×. War risk premiums collapse sharply in a de-escalation.
- Compliance: Named positions are actual public holdings from Trade Republic and Scalable Capital, disclosed qualitatively without position sizes. Not investment advice.
- R23 gate: Reported quarterly numbers remain exclusively for the premium newsletter. Here, only market multiples and qualitative assessments.
CMB.Tech (CMBT) — Leaning Undervalued
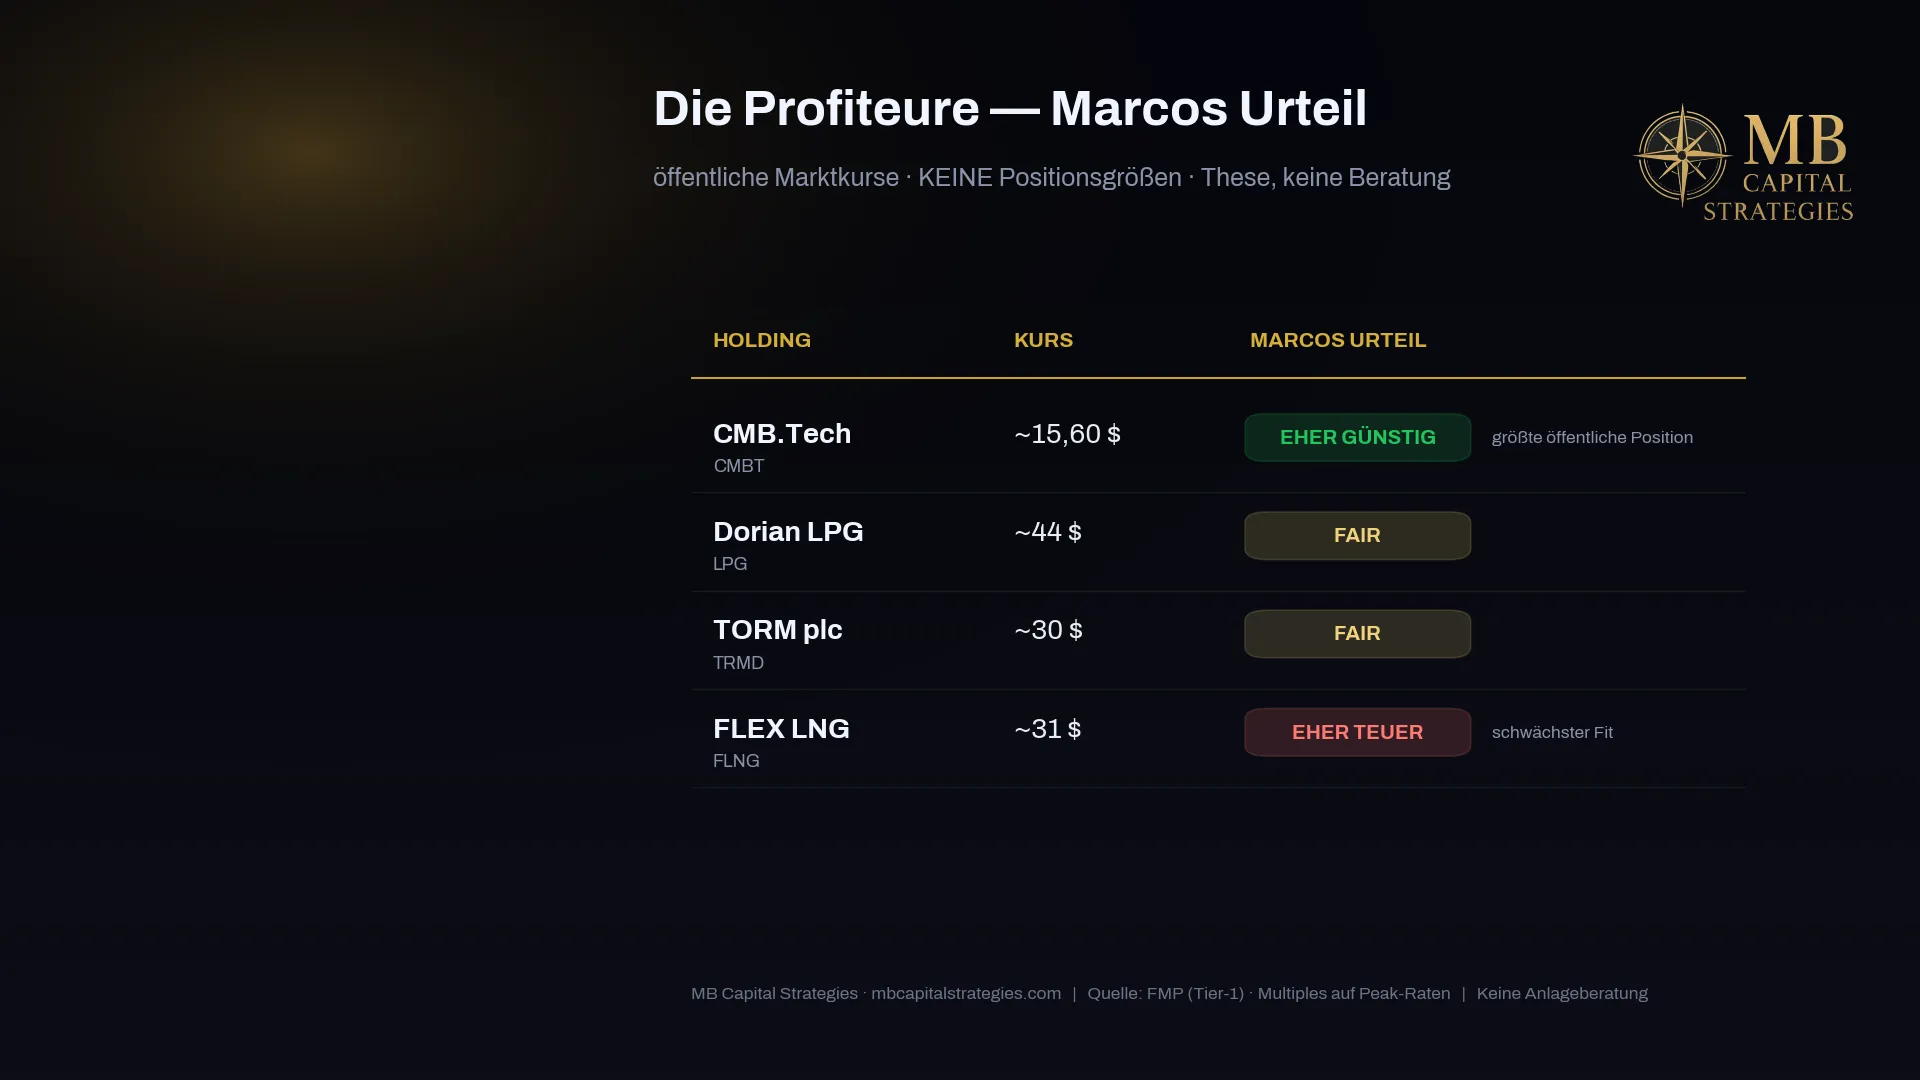
CMB.Tech is my largest public position. Diversification across crude, dry bulk and hydrogen newbuilds reduces peak leverage compared to pure VLCC plays, but also provides better downside protection in a de-escalation. P/B of roughly 1.55× is the cheapest among diversified tankers. Key risk: significantly negative FCF yield from newbuild capex and no aggregate analyst price target. Thesis fit: direct, but diluted by diversification vs. pure VLCC names.
TORM plc (TRMD) — Fair
TORM is the purest product tanker in the comparison. EV/EBITDA around 6.2× (cheapest in the cluster), P/B around 1.34× (lowest, best downside buffer), three analyst buy ratings with a price target around $35. On normalized 2028 earnings estimates, however, P/E rises to roughly 13× — classic cyclicality. Thesis fit: one of the purest double-blow beneficiaries.
Dorian LPG (LPG) — Fair
Dorian carries LPG/VLGCs, not crude — an indirect but solid chokepoint beneficiary. Hormuz disruption lengthens US-to-Asia ton-miles and supports VLGC rates; the fertilizer feedstock effect also fits. FCF yield of roughly 10% is the best among gas names. Shares trading near the 52-week high with thin analyst coverage (4 buys, 5 holds). Thesis fit: indirect, but with solid balance sheet quality.
FLEX LNG (FLNG) — Leaning Overvalued
FLEX LNG is the counterexample in the cluster. The fleet is fully long-term chartered — that protects against rate volatility, but it also means the chokepoint spot-rate boom barely translates. Trailing P/E of 22.4× (most expensive in the cluster), EV/EBITDA of 12.6×, and the sole analyst price target is roughly 20% below the current share price. A 9.6% dividend yield on only 4.5% earnings yield is a warning signal. Thesis fit: worst in the cluster — time-chartered fleet barely participates in the spot rate boom.
Nutrien (NTR) — Leaning Undervalued, Cleanest Fertilizer Beneficiary
Nutrien is the world's largest potash producer and a major North American nitrogen player. The Hormuz fertilizer cascade does not hit North America directly — Canada and the US are not dependent on Hormuz fertilizer imports. Instead, Nutrien benefits from price dislocation: when Hormuz disrupts Middle Eastern urea exports and Egyptian nitrogen plants go offline due to the gas shock, North American prices rise. Trailing P/E of 13.6×, forward 2026 P/E of roughly 11.9×, P/B of ~1.27×, dividend yield of 3.28% with a payout ratio of around 44% — comfortably covered. 20 buy ratings, median price target $82.50 (roughly +20% from the July 22 price). Thesis fit: strongest and most direct beneficiary of the fertilizer cascade.
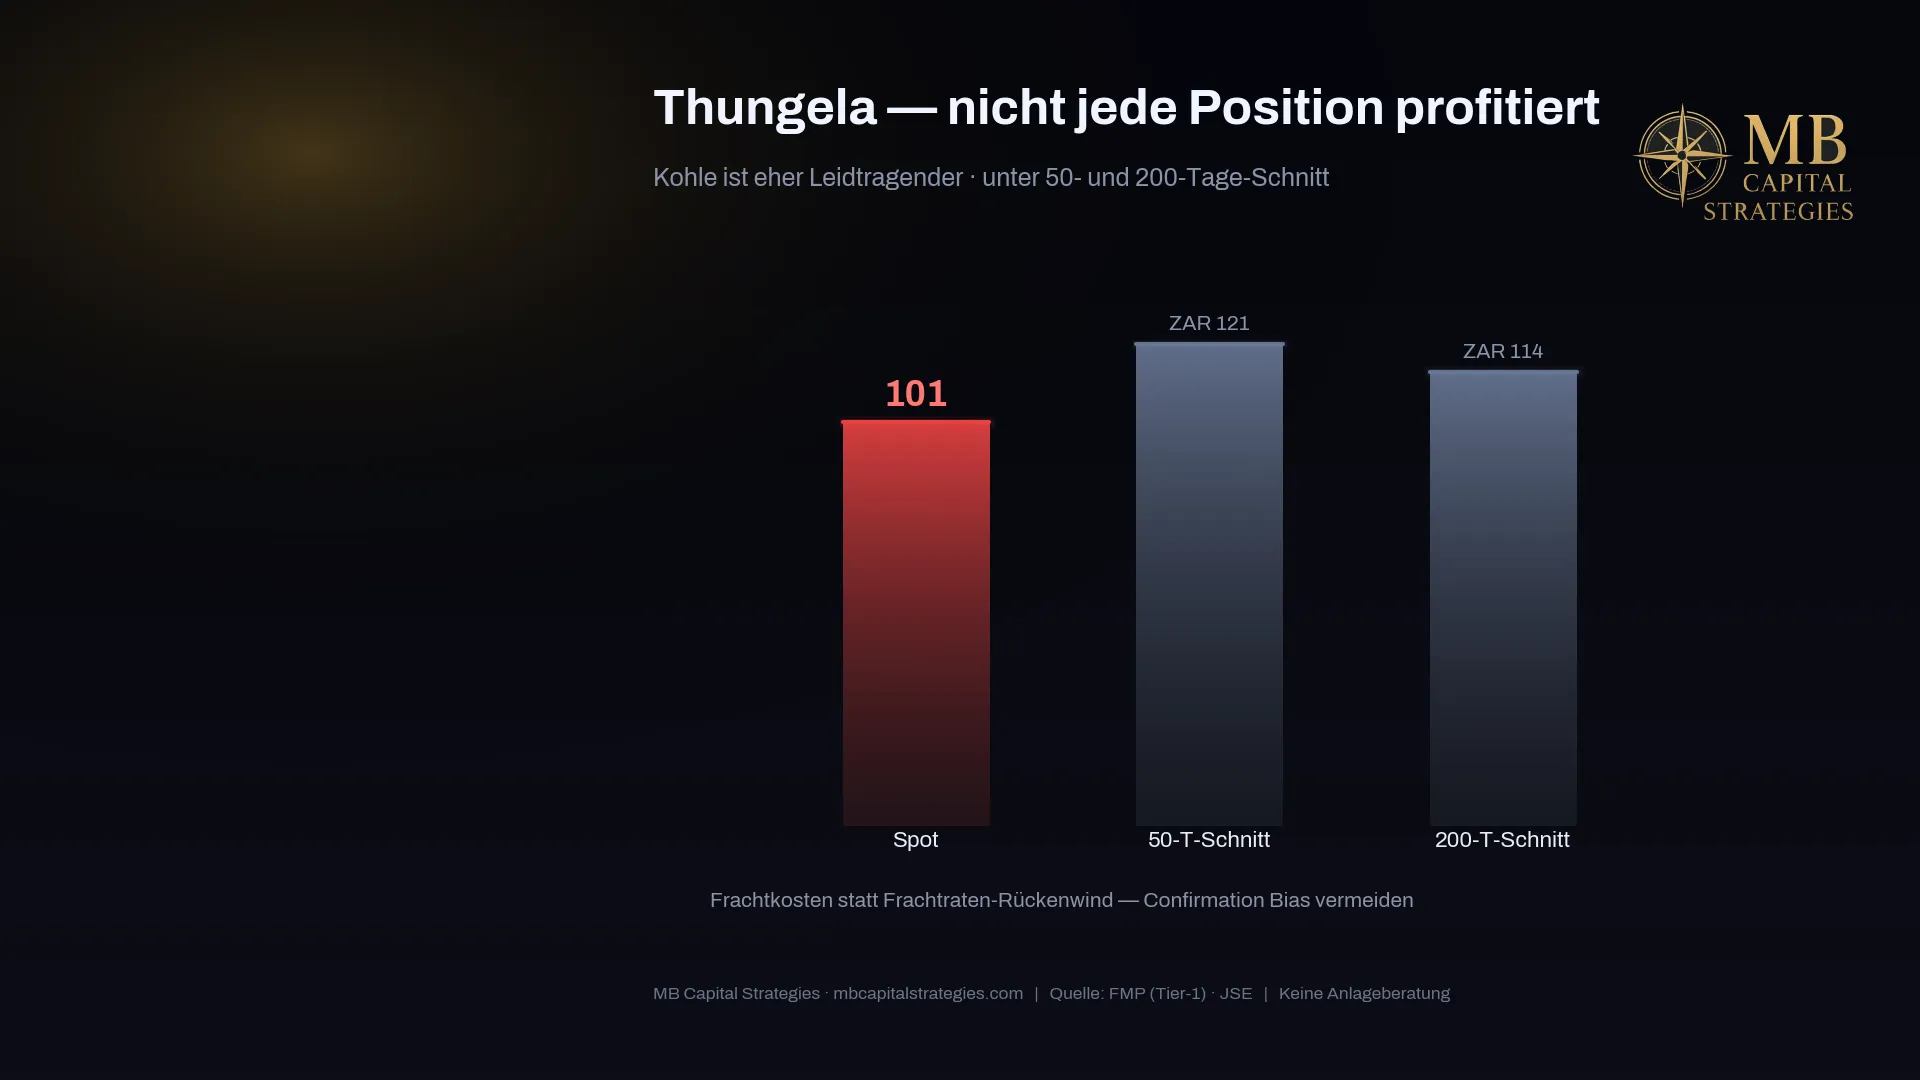
Thungela (TGA.JO): Counterexample — Freight Cost Victim, Not Beneficiary
Not every portfolio position profits. Thungela is trading below both its 50-day and 200-day moving averages (ZAR 101.16 vs. ZAR 120.67 and 113.62 on July 21, 2026). South African coal exports become more expensive when rerouting adds days and freight costs rise. Thungela is, in this context, a freight-cost victim, not a chokepoint winner.
7. The Biggest Risk: A Sudden De-escalation
The same geopolitical force that drives the scenario can flip it. Between June 17 and 20, 2026, a brief de-escalation flare showed exactly this: tanker rates and war risk premiums can correct within hours. Anyone buying at peak rates carries this tail risk. The cyclicality trap and de-escalation risk are not dodge clauses — they are the two most important risk factors for this thesis.
Research Tool: InvestingPro for Your Own Multiples Checks
I use InvestingPro for my valuation analysis — all the multiples in this article (P/E, EV/EBITDA, P/B, FCF yield, analyst price targets) can be checked live and historically there. Save 15% with my link:
Start InvestingPro with −15%Affiliate link: I receive a commission. You pay nothing extra. My editorial content is independent.
Frequently Asked Questions (FAQ)
What is chokepoint economics and why is the Strait of Hormuz so critical?
A chokepoint is a geographically narrow passage through which a disproportionately large share of global trade flows. The Strait of Hormuz is the world's most critical maritime chokepoint: roughly 20% of global oil consumption — about 20 million barrels per day — passes through this 33-kilometre-wide strait. Only about 2.6 million barrels per day can be rerouted via pipeline. When Hormuz is disrupted, oil prices rise, freight insurance costs spike and global supply chains lengthen.
Why does Brent rise even if Hormuz is not fully closed?
Markets price risk, not just reality. A –66% drop in transits (from 157 to 53 per week, Lloyd's List, July 20, 2026) is already enough to embed a risk premium. Add higher insurance costs (war risk at 3–10% of hull value vs. ~0.25% pre-war), longer rerouting via the Cape of Good Hope (+10–15 days) and speculative positioning. Brent was trading at $91.39 on July 21, 2026 — well above both its 50-day and 200-day moving averages.
Which stocks benefit from a Hormuz disruption?
Direct beneficiaries are tanker and gas carrier companies. From my public portfolio (Trade Republic + Scalable Capital), I hold CMB.Tech (CMBT), TORM (TRMD) and Dorian LPG (LPG) — all with direct chokepoint exposure. In the fertilizer segment, Nutrien (NTR) is the cleanest beneficiary of the fertilizer squeeze. FLEX LNG benefits little (time-chartered fleet, minimal spot exposure). This is my personal opinion, not investment advice.
What is the cyclicality trap in tanker stocks?
Trailing P/E ratios for most crude tankers sit at 8–10×, which looks cheap. But these multiples reflect peak rates (VLCC spikes above $420,000/day in March 2026). On normalized forward earnings estimates for 2027/28, P/E rises to 12–16×. In a Hormuz de-escalation, war risk premiums are the first to collapse — and they do so sharply. That is the single biggest risk for tanker investors.
Also Available as Podcast
This analysis is also available as a podcast episode on Spotify and Apple Podcasts — perfect for on the go:
Listen on Spotify Apple Podcasts📚 Related Analysis
Further reading: Tanker Market — Glossary & Key Metrics
top dividend stocks with hard assets — full portfolio picks.